Designing experiments: Number of cohorts per run
In this section we test the model with two catchabilities, to see how many cohorts should be included when we estimate the cohort sizes.
We test one through four cohorts, all starting with the cohort born 1994. The results are given below. The VPA estimates are solid lines with stars at each data point. The estimates of our model are solid lines with 95% confidence intevals, marked with circles at their endpoints.
Summary
 The VPA estimates are contained in the confidence intervals if we estimate one cohort, otherwise this is relatively rare.
 All our population level estimates are higher than the corresponding VPA estimates.
 For all but one of these runs, the mortality is very close to its upper bound of 0.5, which implies that only a fraction of exp(-0.5) = 0.6 of the individuals that escape catch survive to the next year.
 As the number of cohorts increases, the catchabilities frequently become very low, resulting in enourmous N0 estimates and standard deviations.


 Adding a single cohort may result in a dramatic change of the estimates! For instance, compare the single-cohort curves of the cohorts born in 1995 and 1996 (N01995 = 13.2, N01996 = 1.4), with the corresponding estimate of both these cohorts simultaneously (N01995 = 25.0, N01996 = 24.3).
First cohort born in 1994
| Num. cohorts | Trajectories | Estimates |
| 1 | 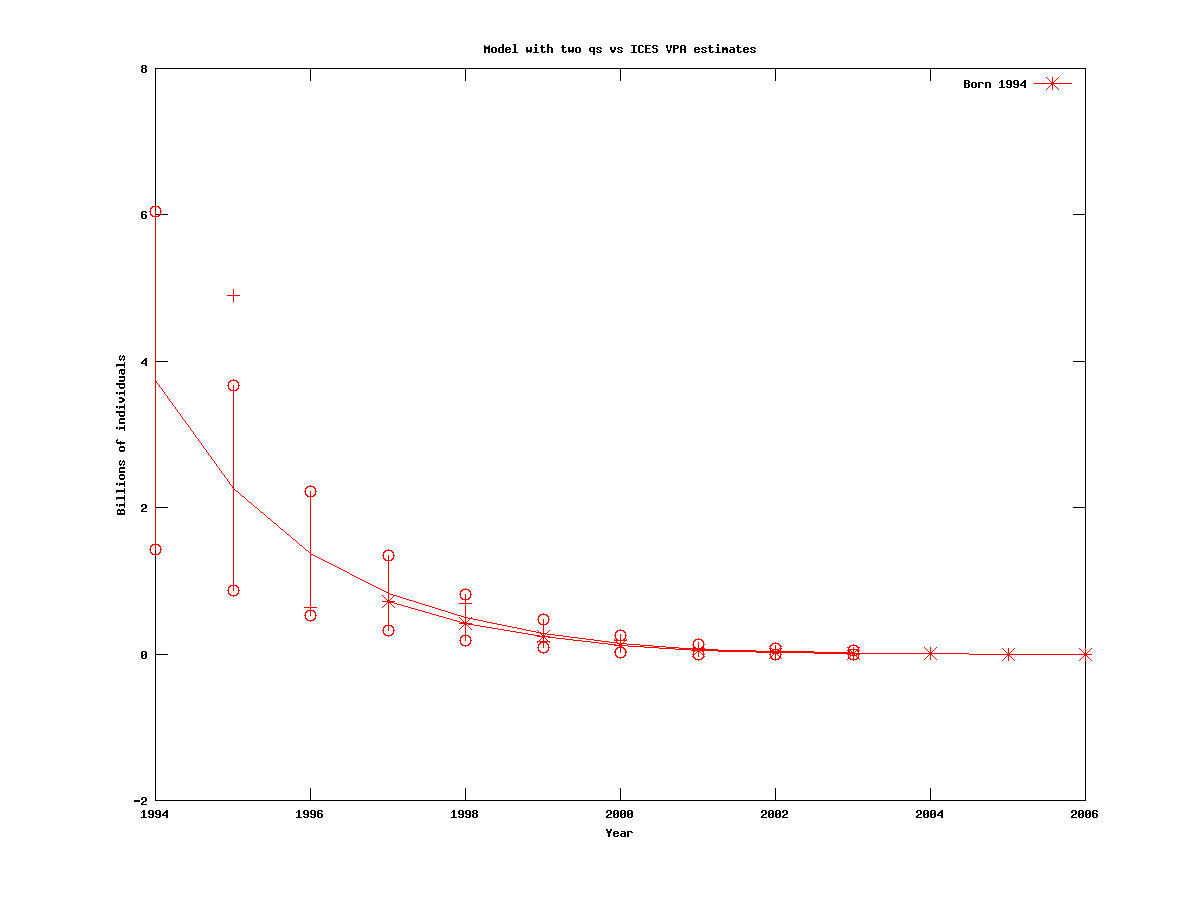 |
- cod.par
# Number of parameters = 5  Objective function value = -3.04279  Maximum gradient component = 1.73377e-05
# N0:
 3.73967
# q02:
 0.534052
# q3plus:
 0.264136
# logs:
-0.838087371588
# M:
0.499999482423
|
| 2 | 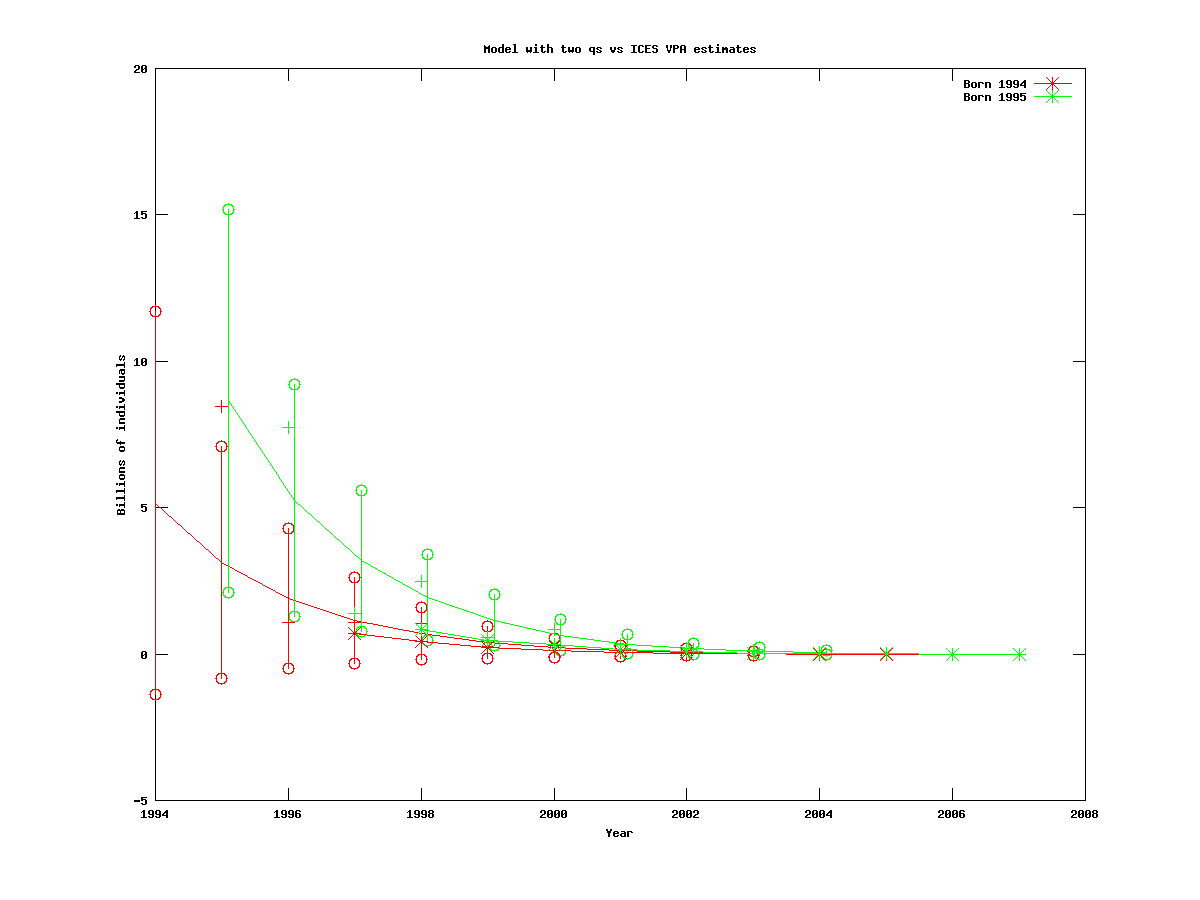 |
- cod.par
# Number of parameters = 6  Objective function value = -5.77776  Maximum gradient component = 2.11613e-05
# N0:
 5.15625 8.65463
# q02:
 0.310201
# q3plus:
 0.172795
# logs:
-0.820986726847
# M:
0.499999794894
|
| 3 | 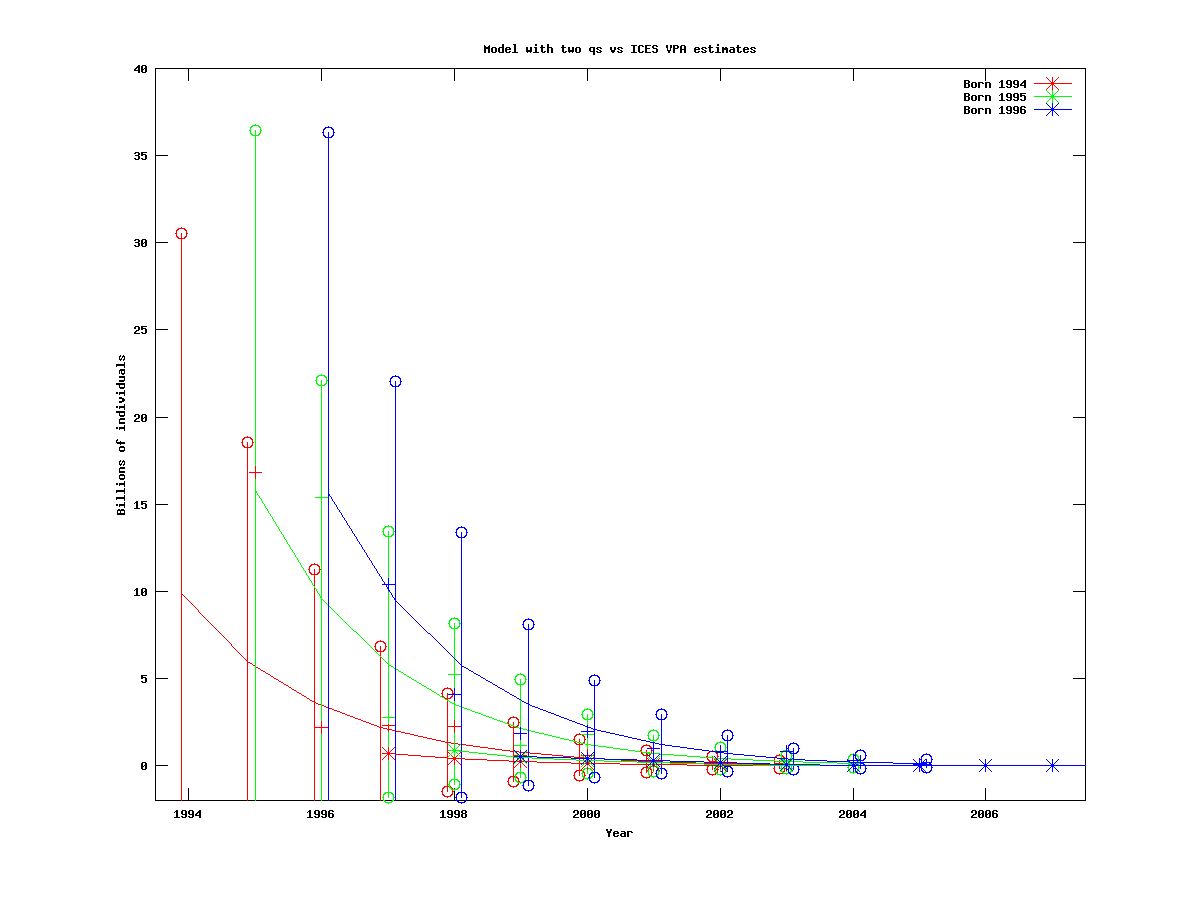 |
- cod.par
# Number of parameters = 7  Objective function value = -9.32250  Maximum gradient component = 8.97114e-05
# N0:
 9.86150 15.7734 15.6412
# q02:
 0.155877
# q3plus:
 0.0814100
# logs:
-0.845277808029
# M:
0.499999858299
|
| 4 | 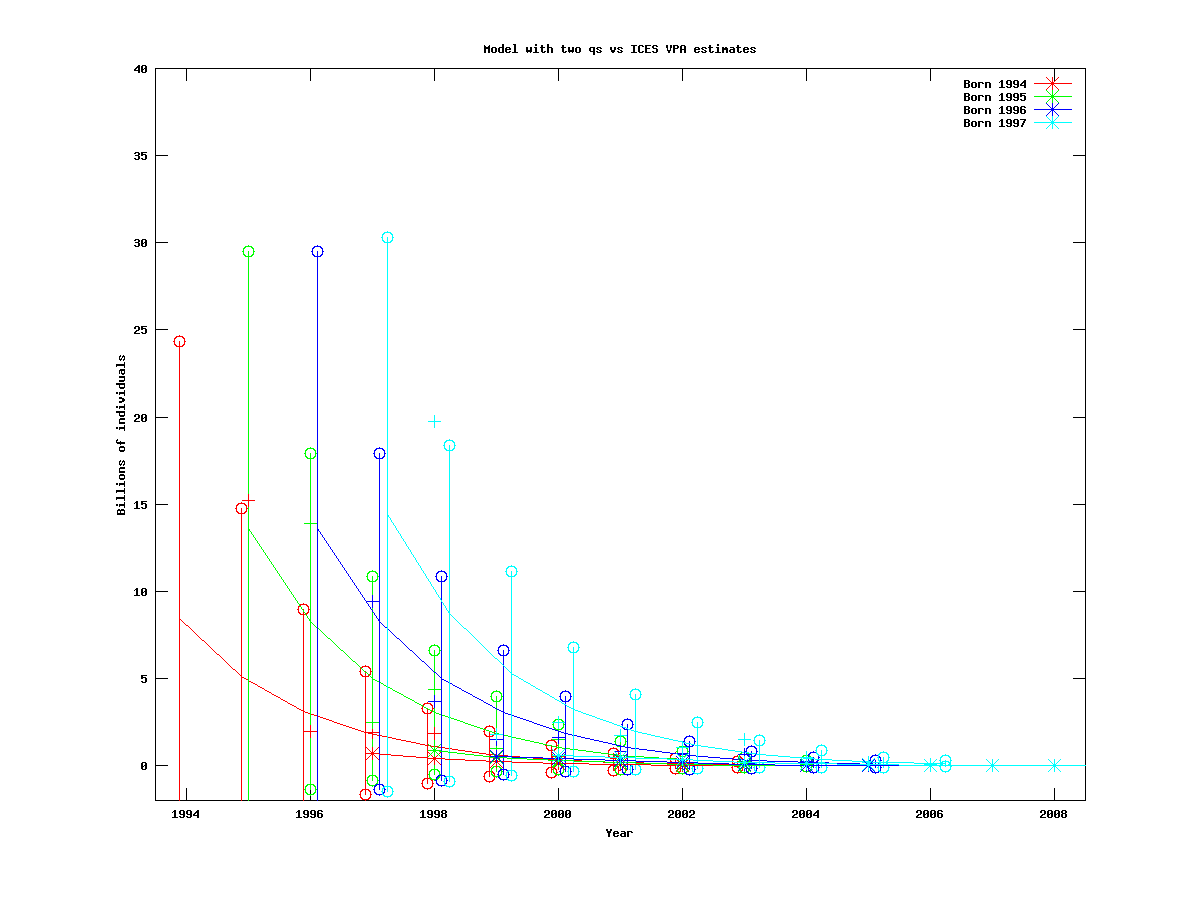 |
- cod.par
# Number of parameters = 8  Objective function value = -9.71777  Maximum gradient component = 2.08793e-05
# N0:
 8.43390 13.5985 13.6065 14.4040
# q02:
 0.172378
# q3plus:
 0.0982044
# logs:
-0.769938145537
# M:
0.499999811181
|
First cohort born in 1995
| Num. cohorts | Trajectories | Estimates |
| 1 | 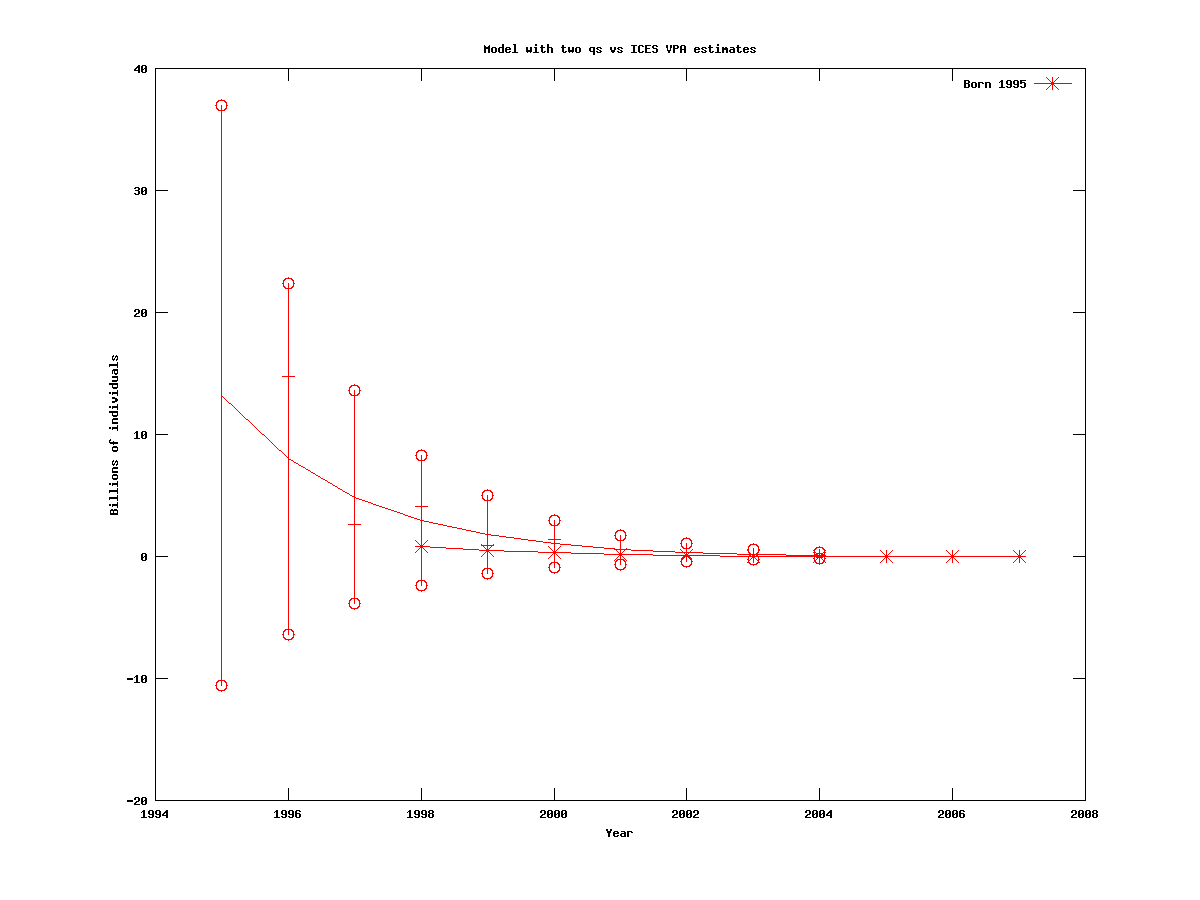 | # Number of parameters = 5 Objective function value = -3.78892 Maximum gradient component = 1.35662e-05
# N0:
13.2035
# q02:
0.162841
# q3plus:
0.103909
# logs:
-0.920990967088
# M:
0.499999623325
|
| 2 | 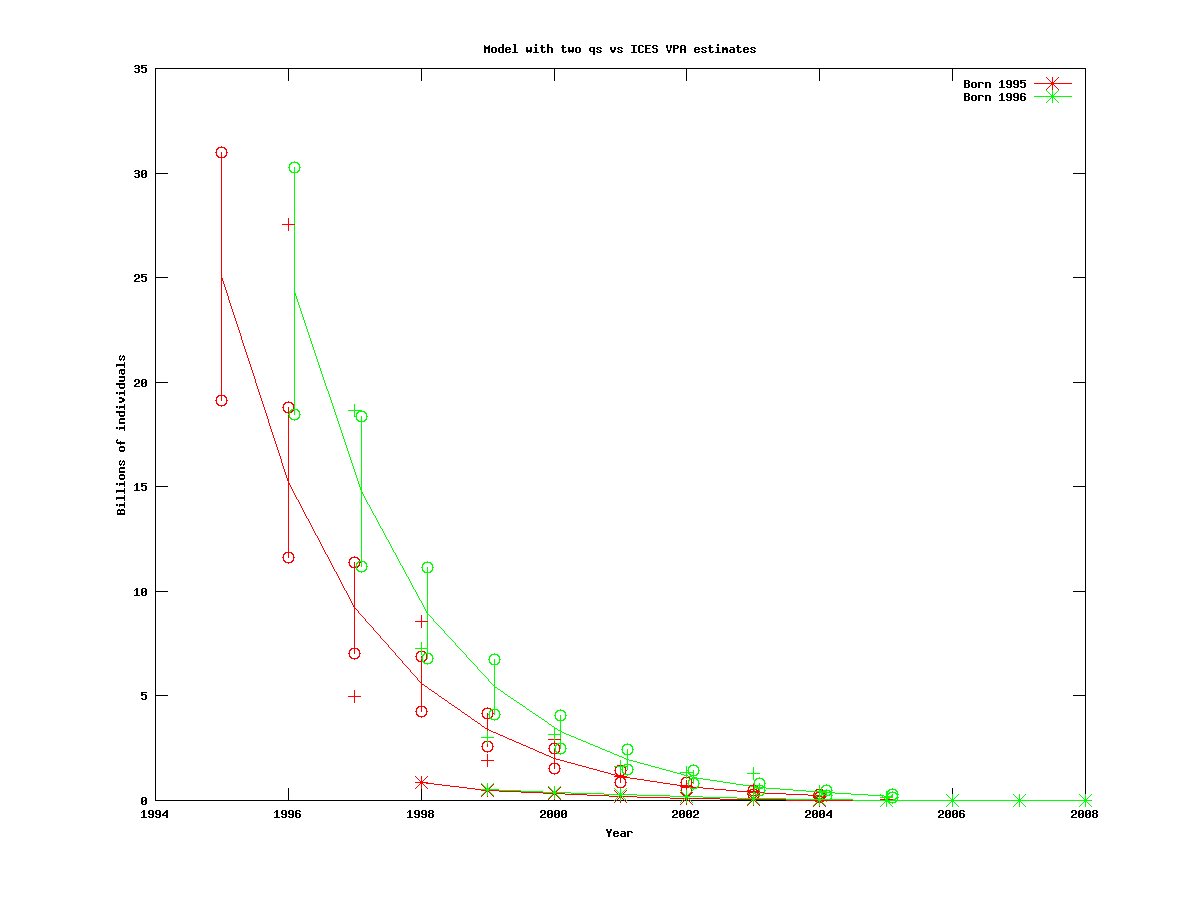 | # Number of parameters = 6 Objective function value = -8.36351 Maximum gradient component = 2.76582e-05
# N0:
25.0513 24.3592
# q02:
0.0869528
# q3plus:
0.0500003
# logs:
-0.964639320769
# M:
0.499996084223
|
| 3 | 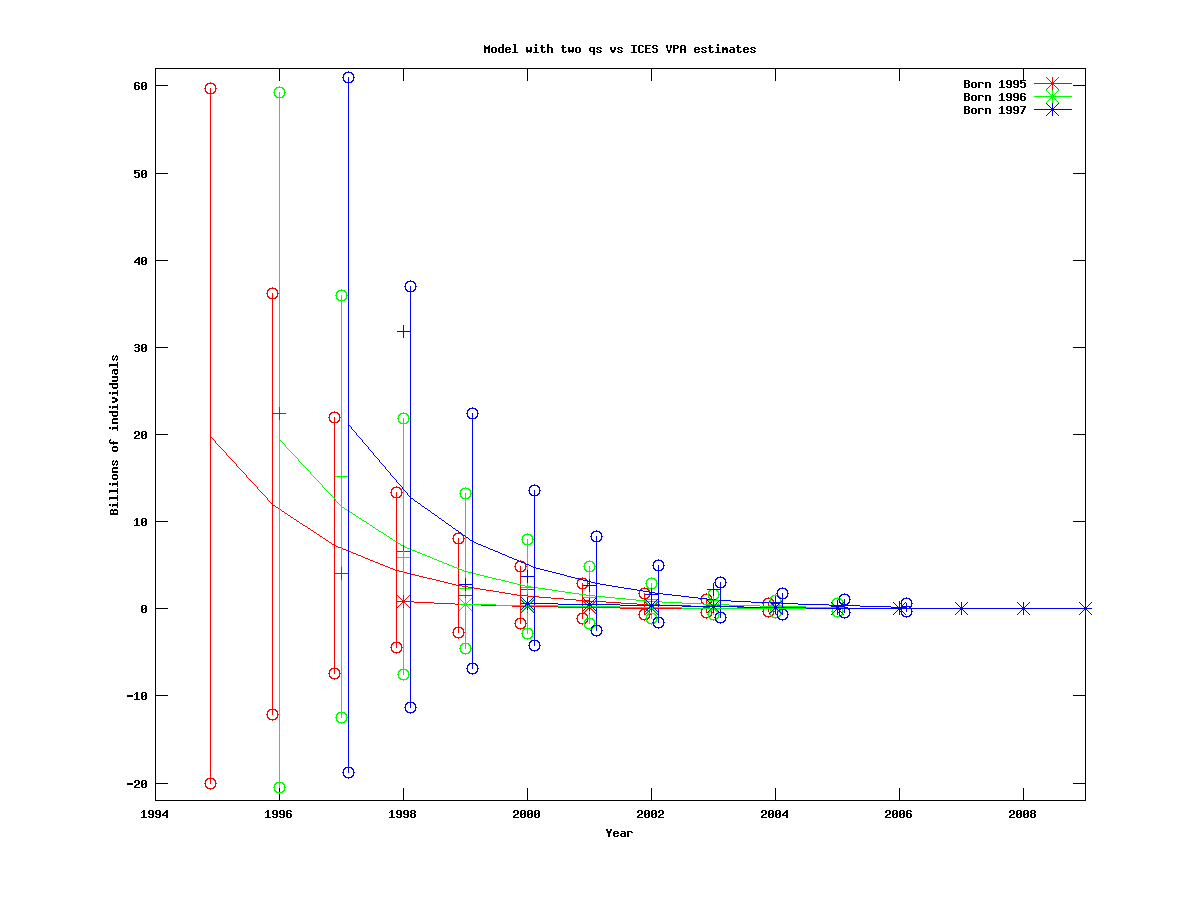 | # Number of parameters = 7 Objective function value = -8.32085 Maximum gradient component = 3.47608e-05
# N0:
19.7963 19.4032 21.1197
# q02:
0.106997
# q3plus:
0.0652565
# logs:
-0.808179492251
# M:
0.499999425716
|
| 4 | 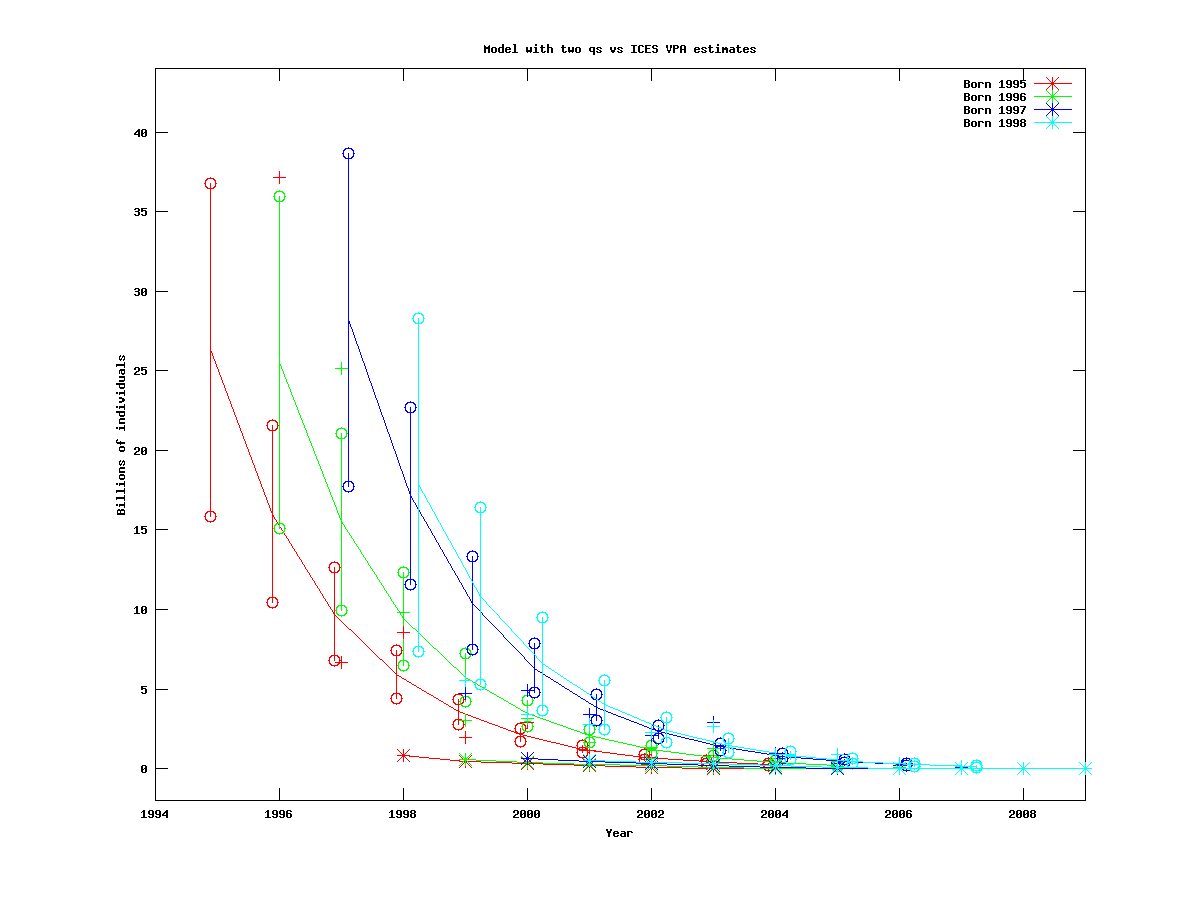 | # Number of parameters = 8 Objective function value = -10.1346 Maximum gradient component = 3.28127e-05
# N0:
26.3255 25.5297 28.2046 17.8431
# q02:
0.0645267
# q3plus:
0.0500002
# logs:
-0.781517782844
# M:
0.498264587840
|
First cohort born in 1996
| Num. cohorts | Trajectories | Estimates |
| 1 | 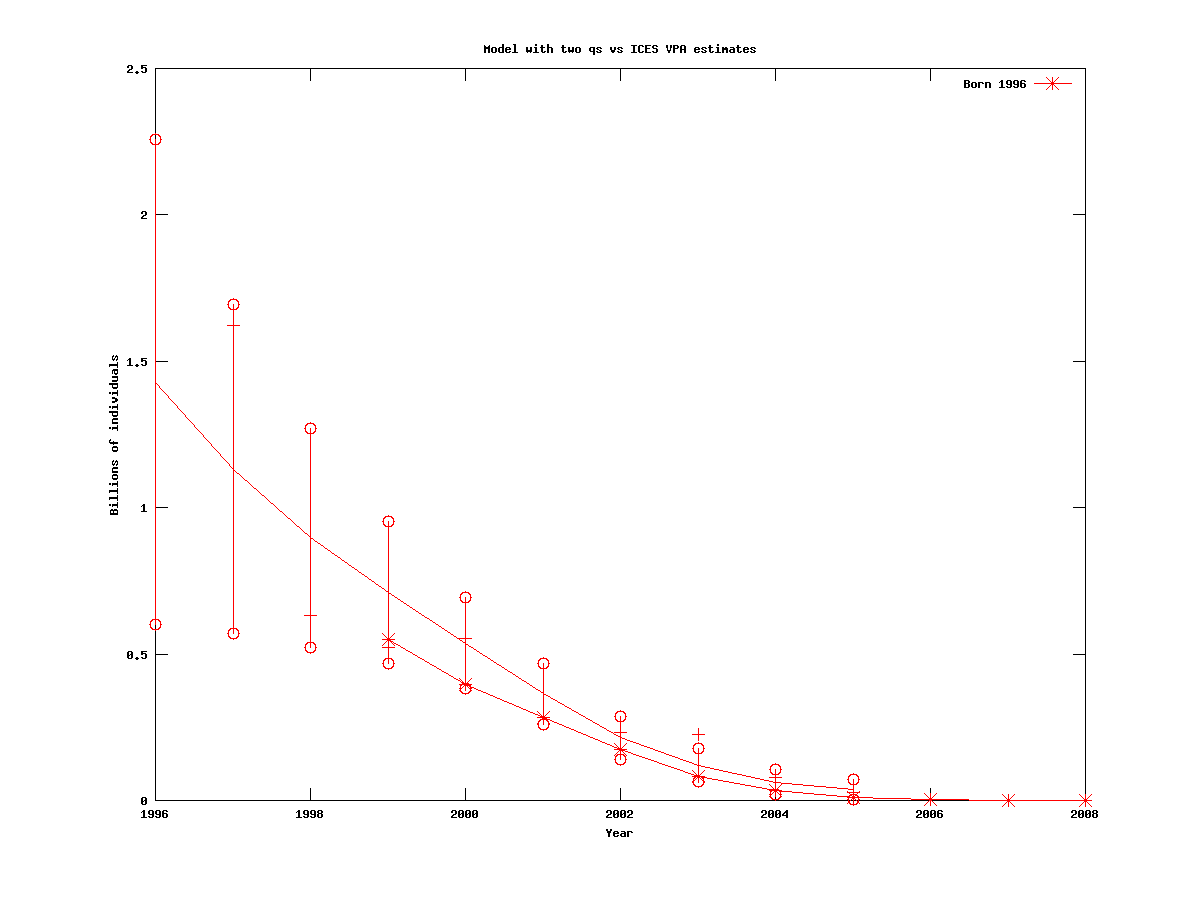 | # Number of parameters = 5 Objective function value = -5.44646 Maximum gradient component = 1.41821e-05
# N0:
1.42868
# q02:
0.999990
# q3plus:
0.286636
# logs:
-1.10516259475
# M:
0.232826691724
|
| 2 | 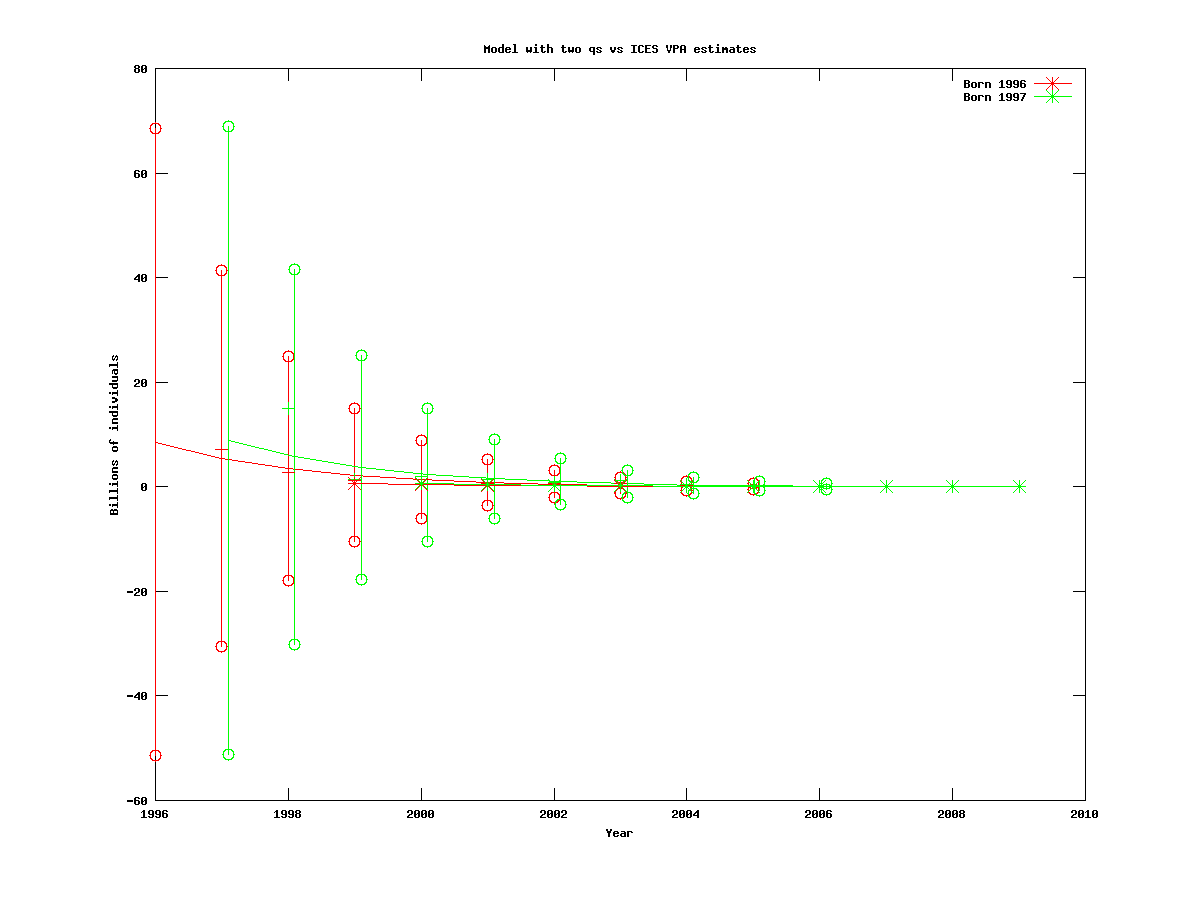 | # Number of parameters = 6 Objective function value = -4.76962 Maximum gradient component = 5.91776e-05
# N0:
8.55080 8.90523
# q02:
0.227277
# q3plus:
0.120375
# logs:
-0.764979137800
# M:
0.446238565249
|
| 3 | 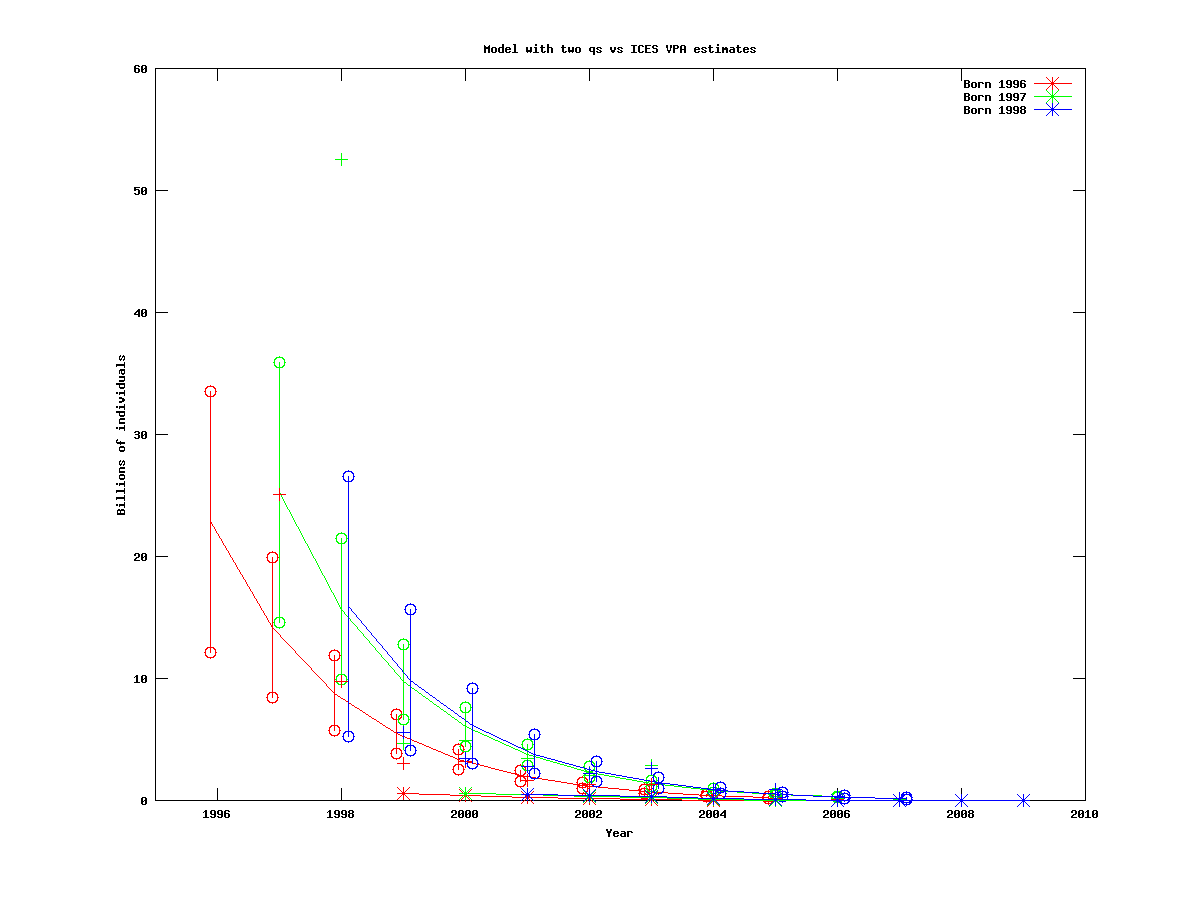 | # Number of parameters = 7 Objective function value = -7.13482 Maximum gradient component = 1.71159e-05
# N0:
22.8408 25.2584 15.9061
# q02:
0.0646987
# q3plus:
0.0500008
# logs:
-0.764252477712
# M:
0.477038134661
|
| 4 | 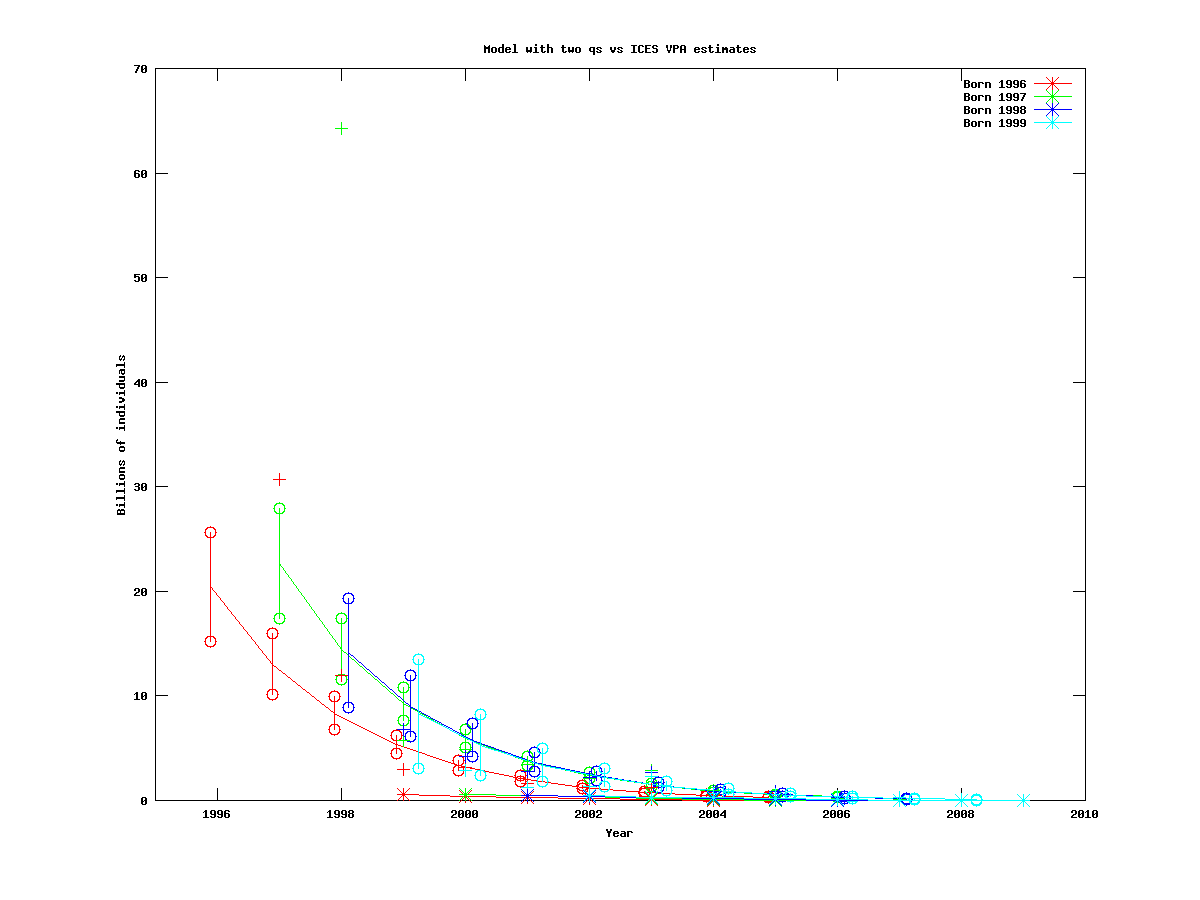 | # Number of parameters = 8 Objective function value = -7.09015 Maximum gradient component = 5.52112e-05
# N0:
20.4272 22.6736 14.1181 8.28681
# q02:
0.0528935
# q3plus:
0.0500000
# logs:
-0.696948684580
# M:
0.448148822839
|
First cohort born in 1997
| Num. cohorts | Trajectories | Estimates |
| 1 | 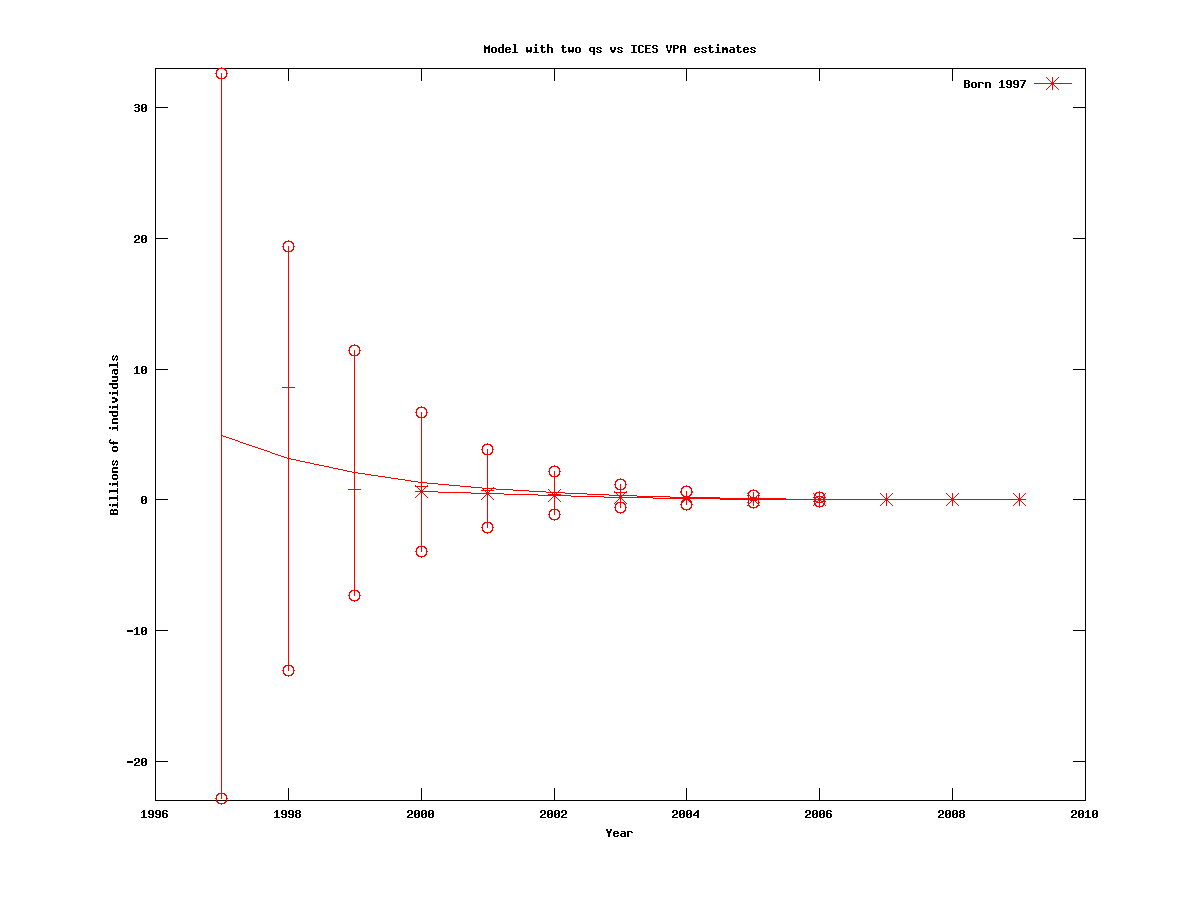 | # Number of parameters = 5 Objective function value = -1.05638 Maximum gradient component = 9.05723e-05
# N0:
4.89011
# q02:
0.397356
# q3plus:
0.240624
# logs:
-0.617375605607
# M:
0.431388898483
|
| 2 | 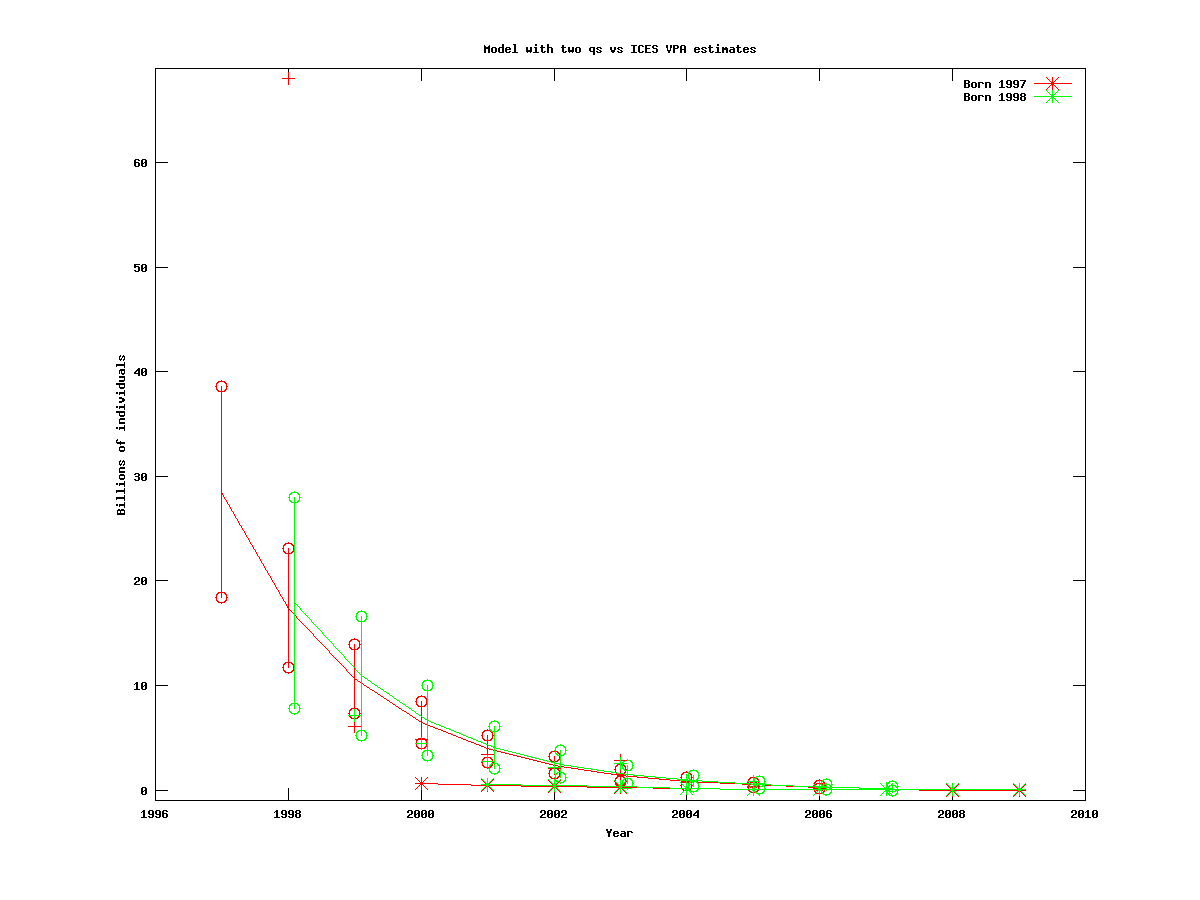 | # Number of parameters = 6 Objective function value = -3.83632 Maximum gradient component = 4.85609e-05
# N0:
28.5002 17.9068
# q02:
0.0500005
# q3plus:
0.0511446
# logs:
-0.713128709914
# M:
0.493607769179
|
| 3 | 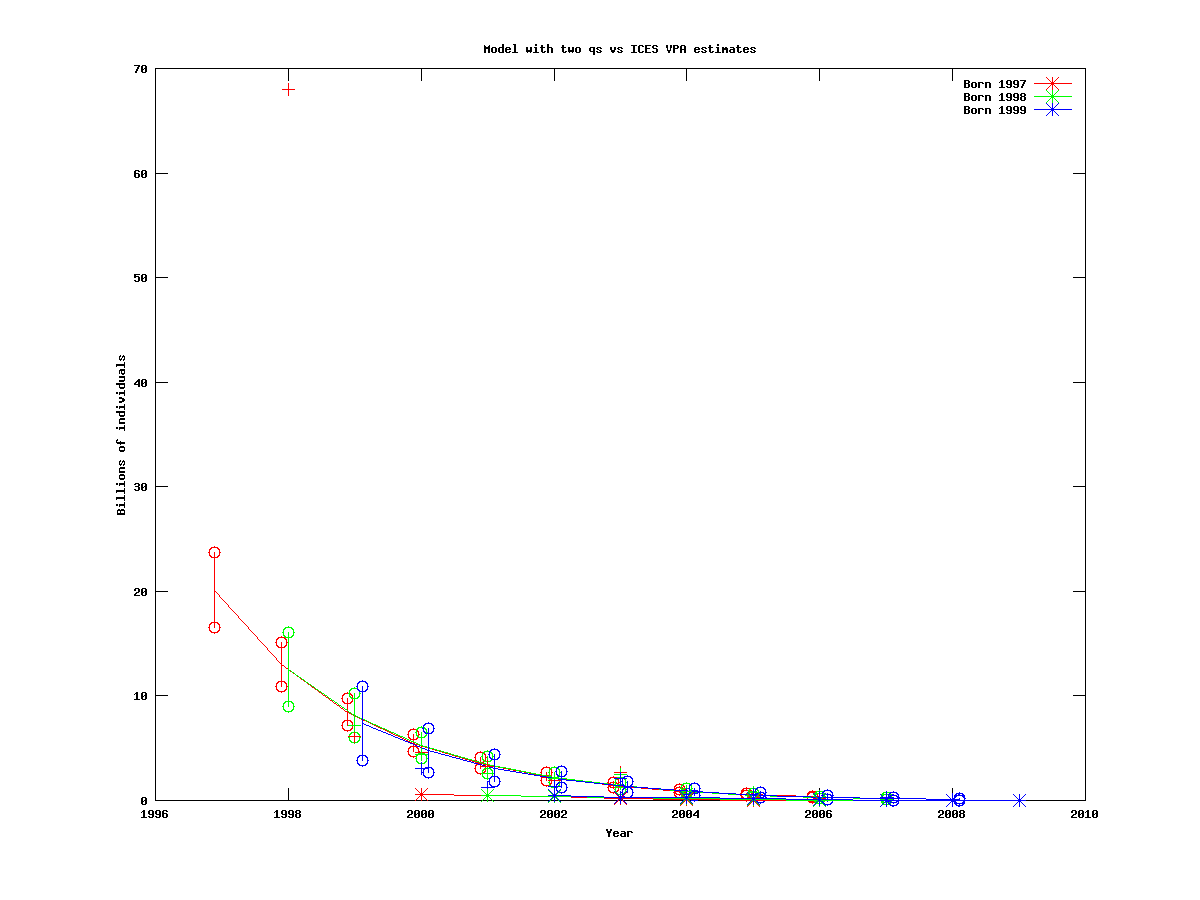 | # Number of parameters = 7 Objective function value = -5.21248 Maximum gradient component = 6.02790e-05
# N0:
20.1159 12.5133 7.34955
# q02:
0.0500000
# q3plus:
0.0535634
# logs:
-0.693054885474
# M:
0.432873809737
|
| 4 | 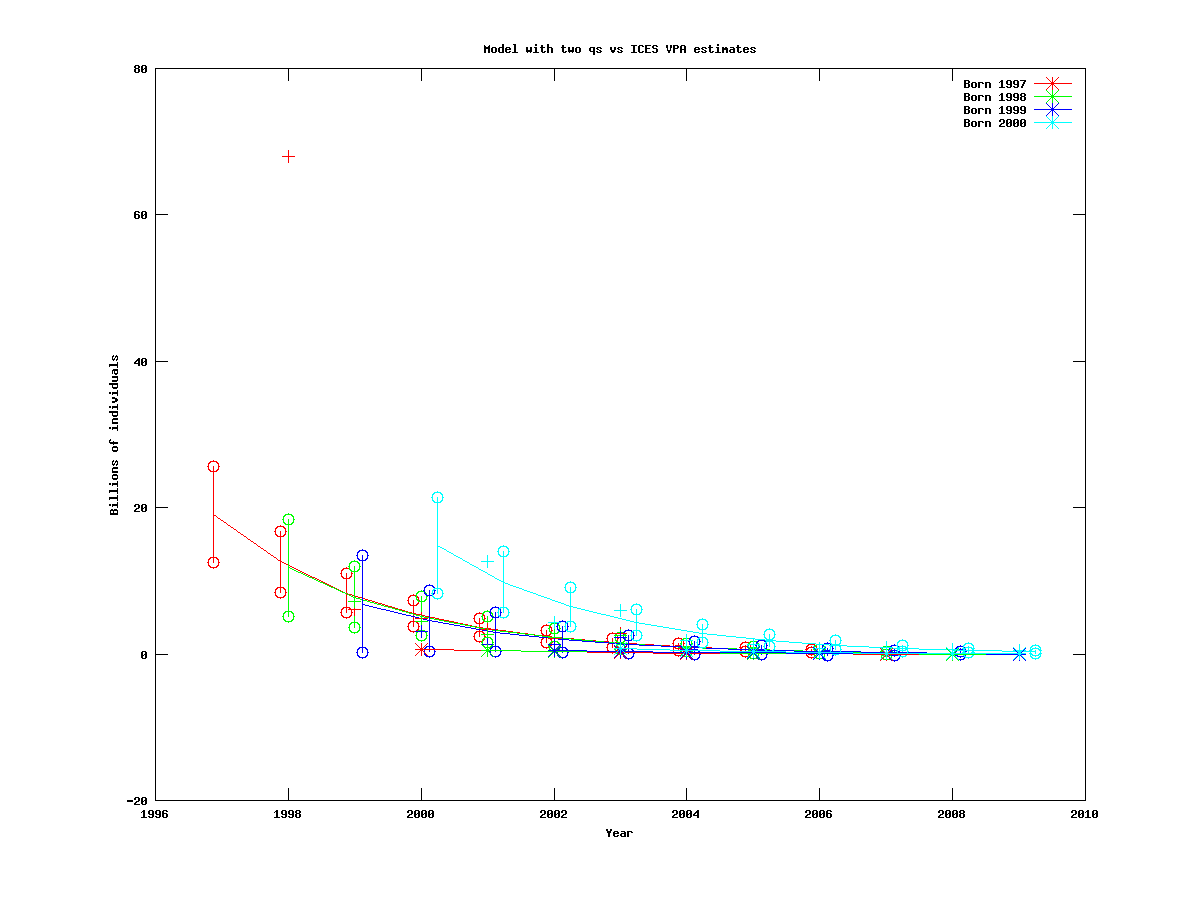 | # Number of parameters = 8 Objective function value = -8.95260 Maximum gradient component = 7.00101e-05
# N0:
19.0441 11.7696 6.83848 14.8314
# q02:
0.0500000
# q3plus:
0.0504351
# logs:
-0.748683287864
# M:
0.413269330095
|


