Table of Contents
Comparison of models with VPA
The purpose of this section is to compare the estimates from our model, with those of the ICES VPA models.

VPA trajectories and confidence intervals for the estimated population trajectories
One feature of ADMB is that it can produce standard deviations of dependent variables as well as independent variables, so that the user does not need to employ the delta method or similar techniques. In this section we plot the corresponding confidence intervals for the models given in the section on real data.
In addition, each plot includes the corresponding VPA estimates for each population, for comparison.
Choosing which cohorts to estimate
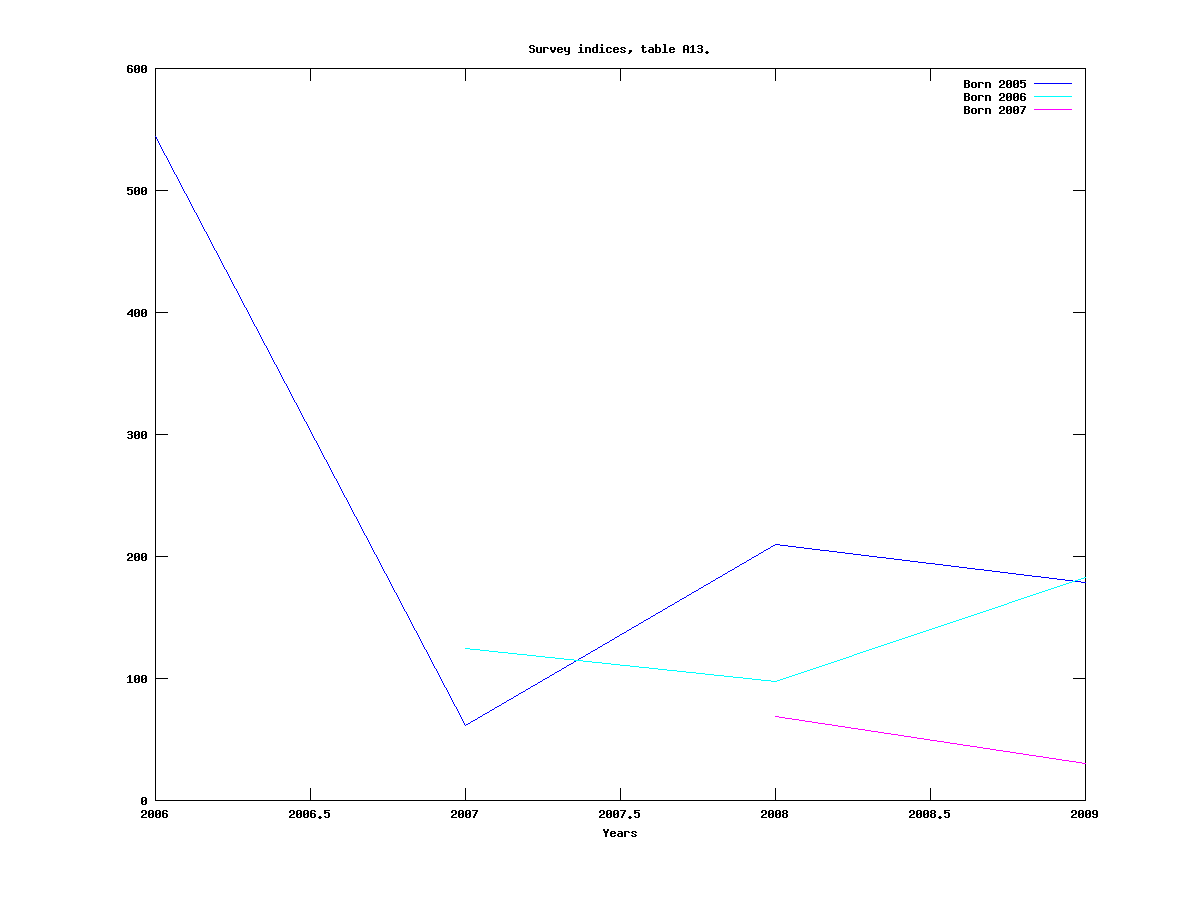
We assume that from a numerical point of view, it is beneficial to estimate cohorts of large size. To get an idea of which cohorts are the largest we plot the survey indices, given below:
As can be seen, the cohorts born in 1994 to 1997 seem to be the strongest. Also, the curves are not monotonic, with the curve for the cohort born 1988 having a particularly challenging shape. This should be taken into consideration when designing the model.
Simple model
This is the so-called simple model, defined here.
We estimate the four cohorts born 1994-1997, and get:
 |
|
The solid curves with starred points are the VPA estimates, and the solid lines with error bars ending in circles are the estimates of our model, with the circles denoting the end of the 95% confidence intervals.

As one can see, the VPA estimates are for the most part (for the red, green, and most of the blue trajectory) within the confidence intervals of our model. However, it seems the simple model overestimates the population size, compared with VPA.

Model with two mortality parameters
This model has a different mortality for ages seven and up, and is defined here.
The results on the cohorts born 1994-1997 are:
 |
|

Model with two catchabilities
This model has a separate catchability for ages 3 and up, and is defined here.
The results on the cohorts born 1994-1997 are:
 |
|
Once again the mortality is at its upper bound. The confidence intervals for ages 0-2 are huge, but all the VPA estimates starting at age 3 are within the confidence intervals of the model, which are much smaller for these ages.
Since it in general seems to be very difficult to make inferences about 0-2 year olds, it could be worthwile to study the plot starting with the model's estimates for 3-year olds. This is shown in the following plot:

Model with two mortality parameters and two catchabilities
This model is the combination of the two preceding models. It is defined here.
The results on the cohorts born 1994-1997 are:
 |
|


