User Tools

Site Tools


admb_real:n3_cohorts_per_run_monotonic

Model estimating 3 year olds and older --- monotonic survey data

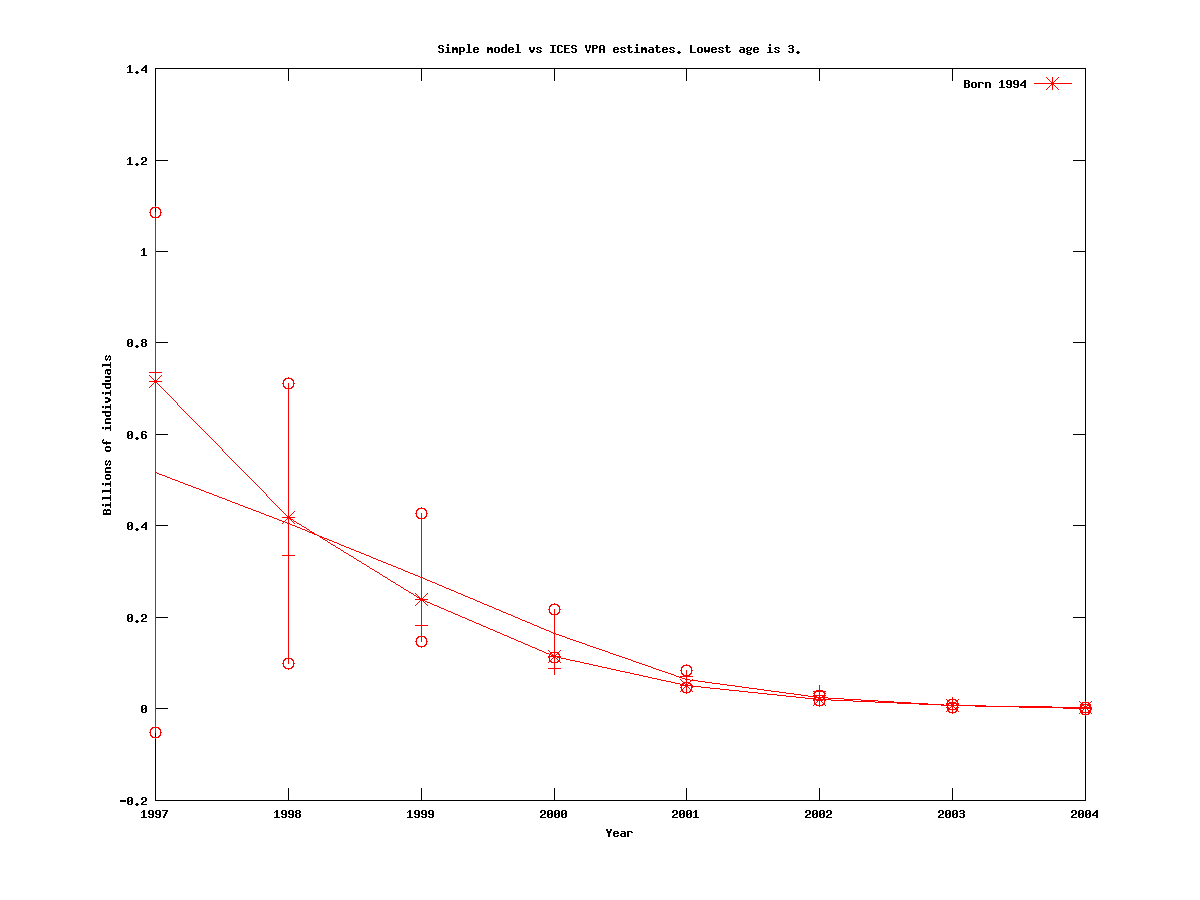
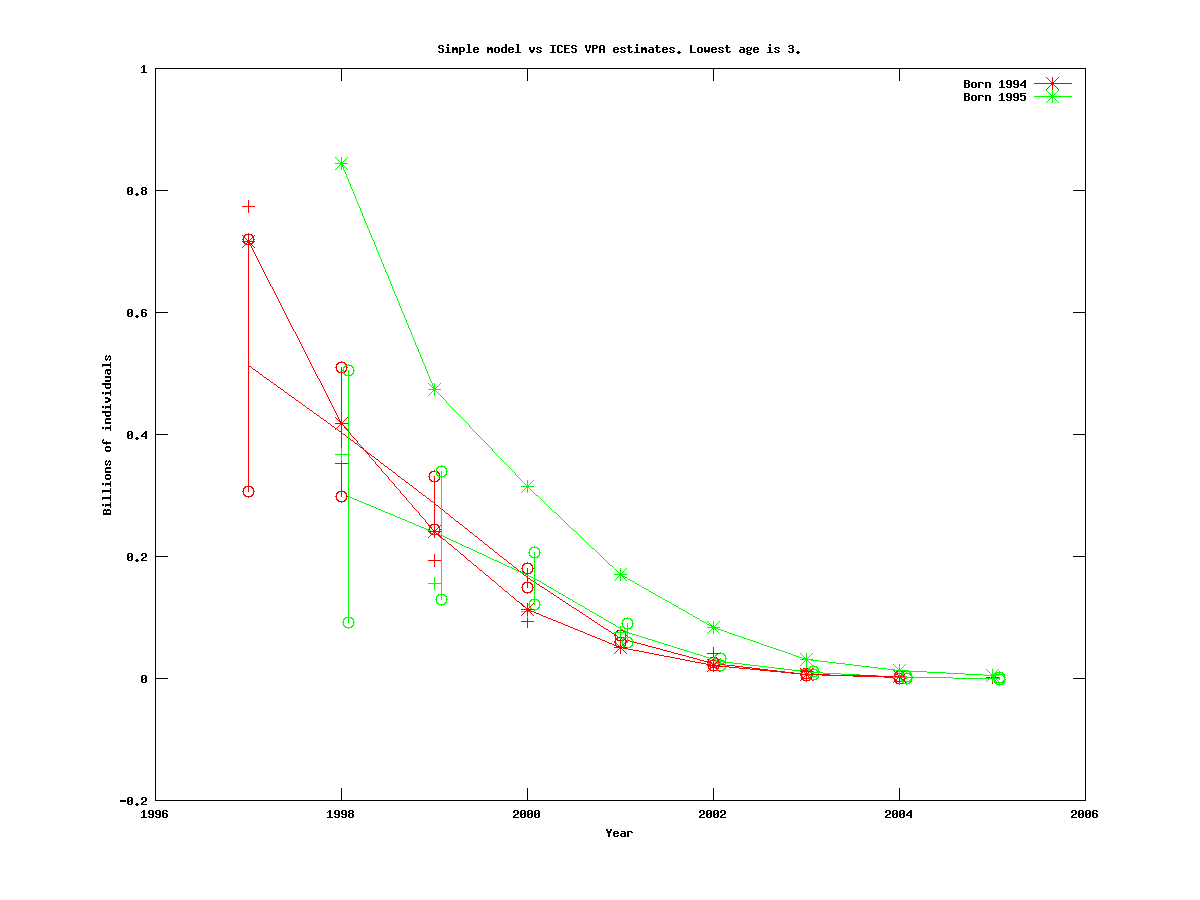
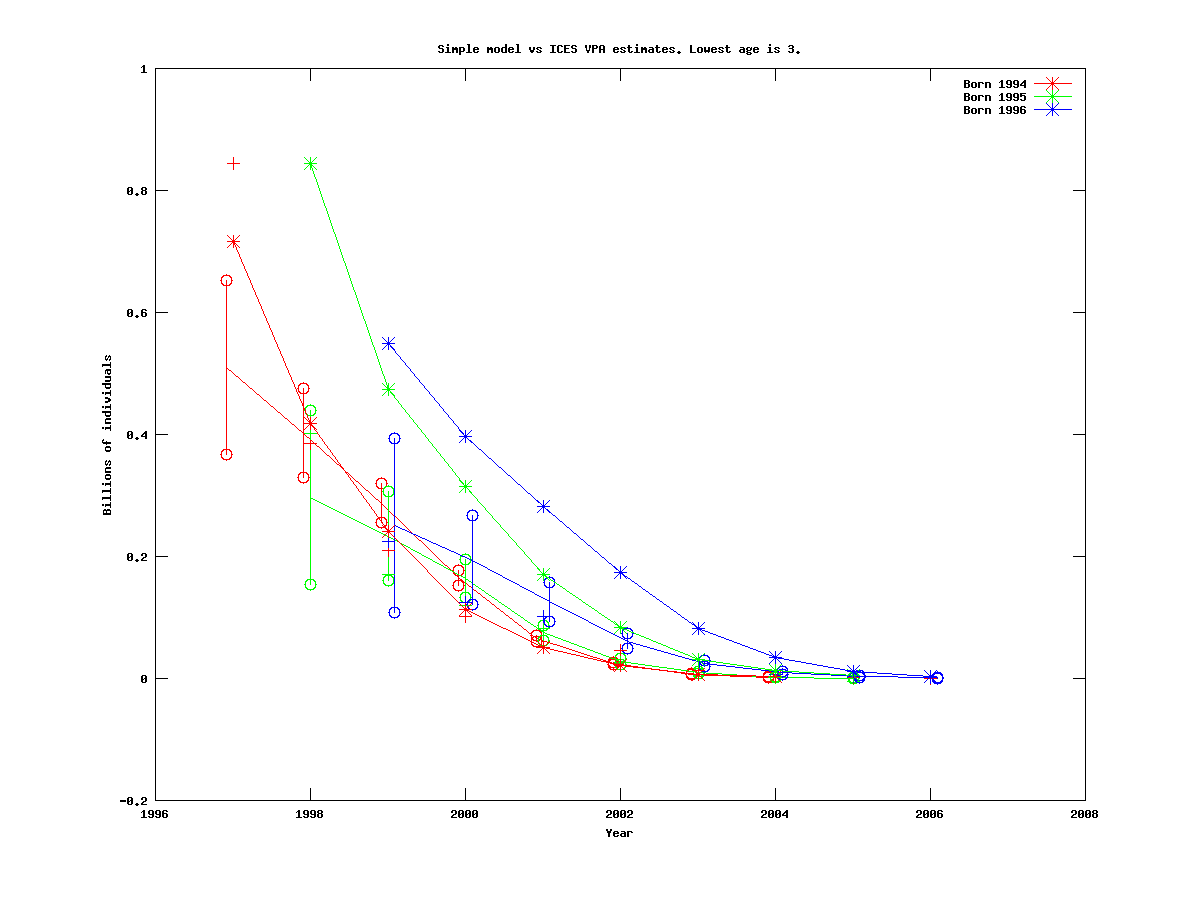
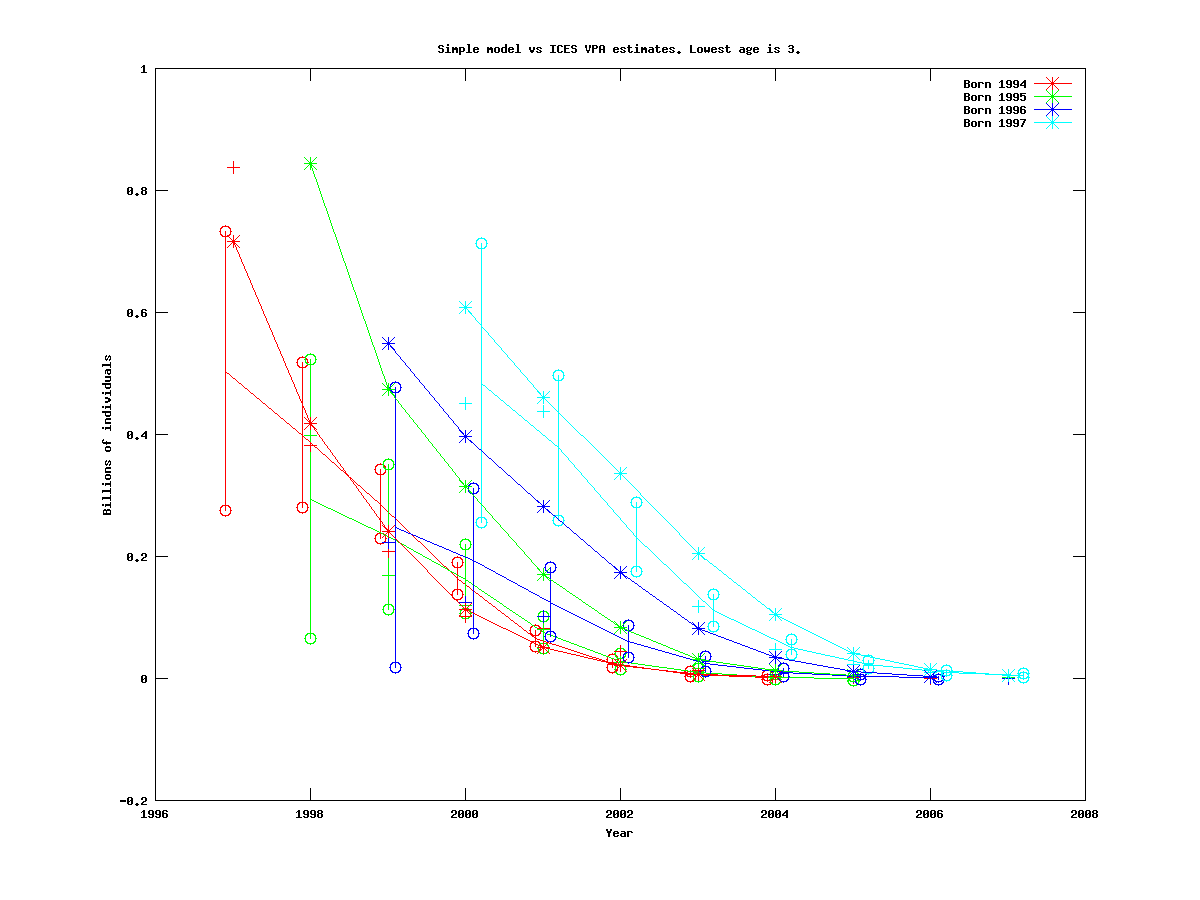
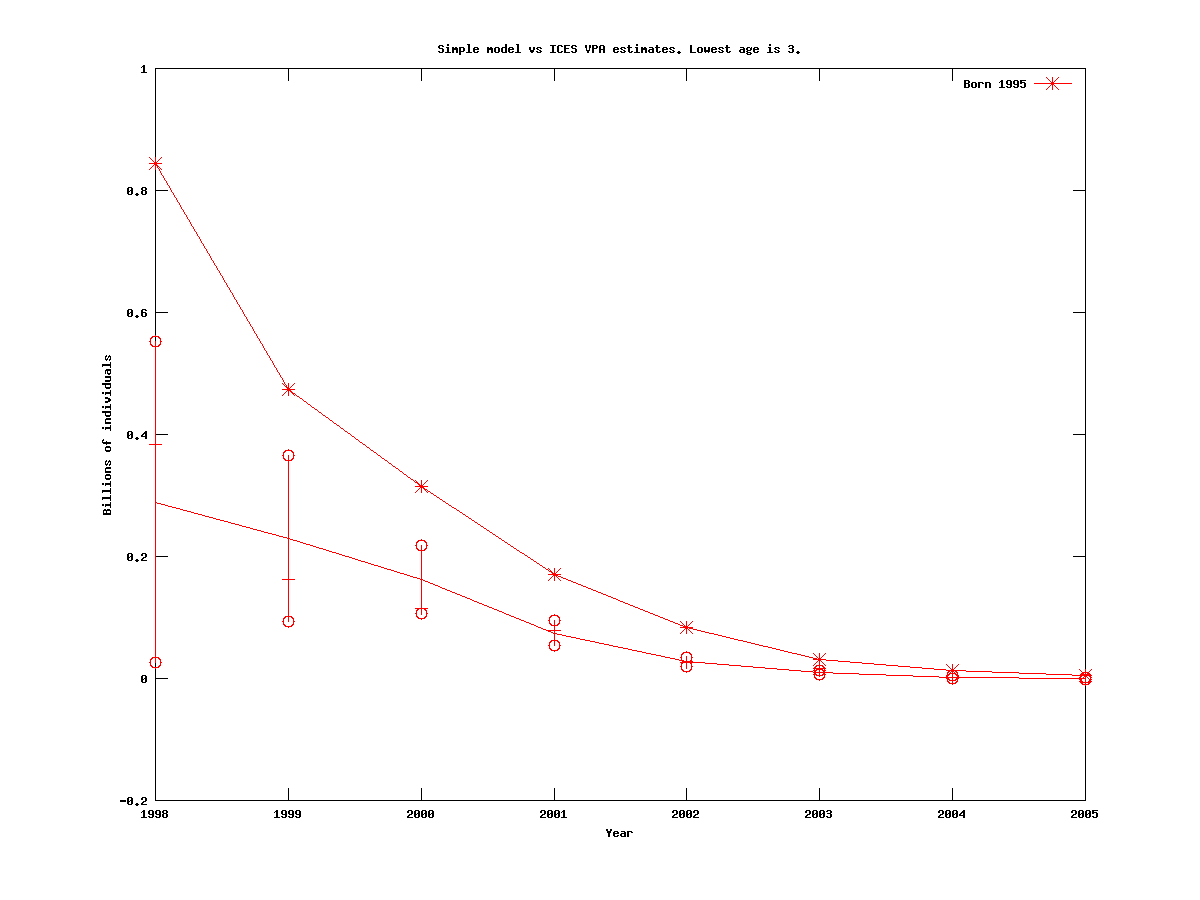
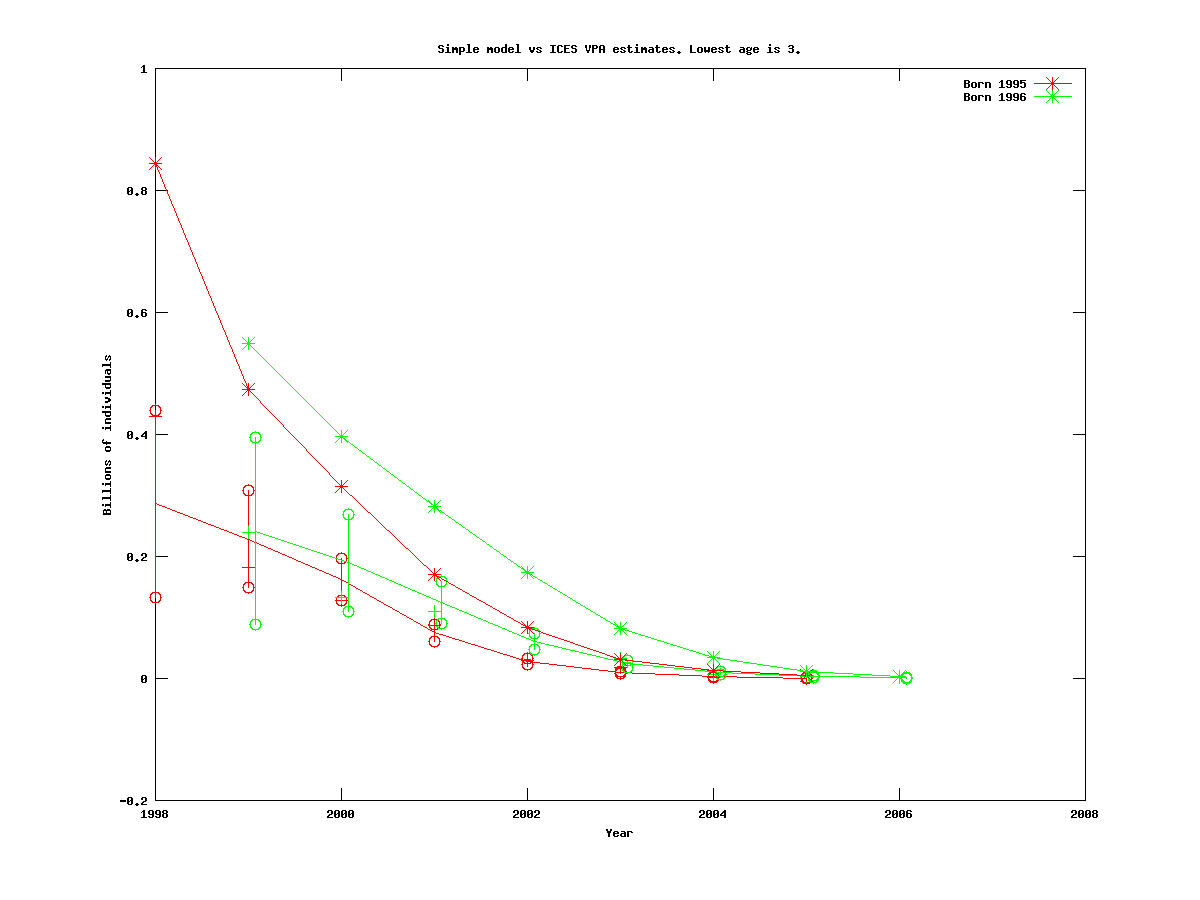
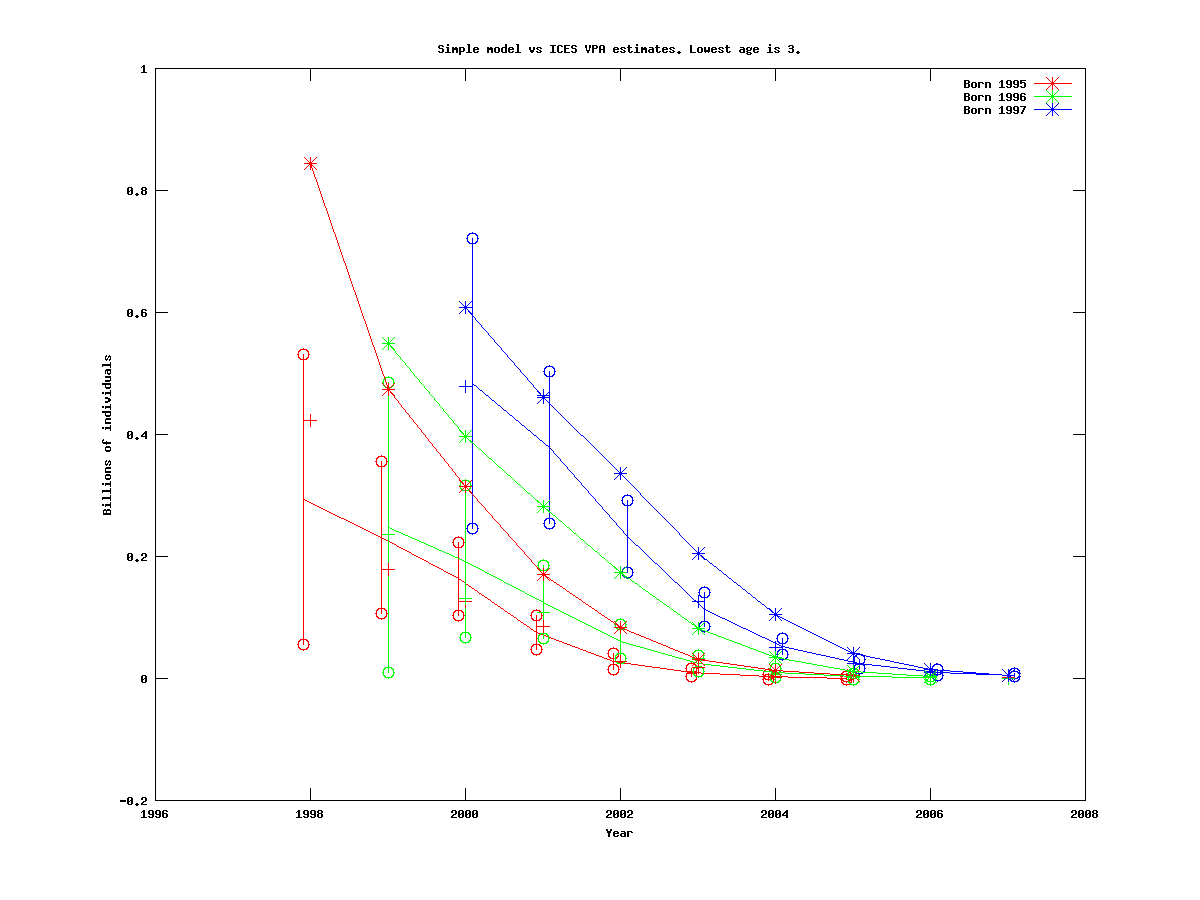
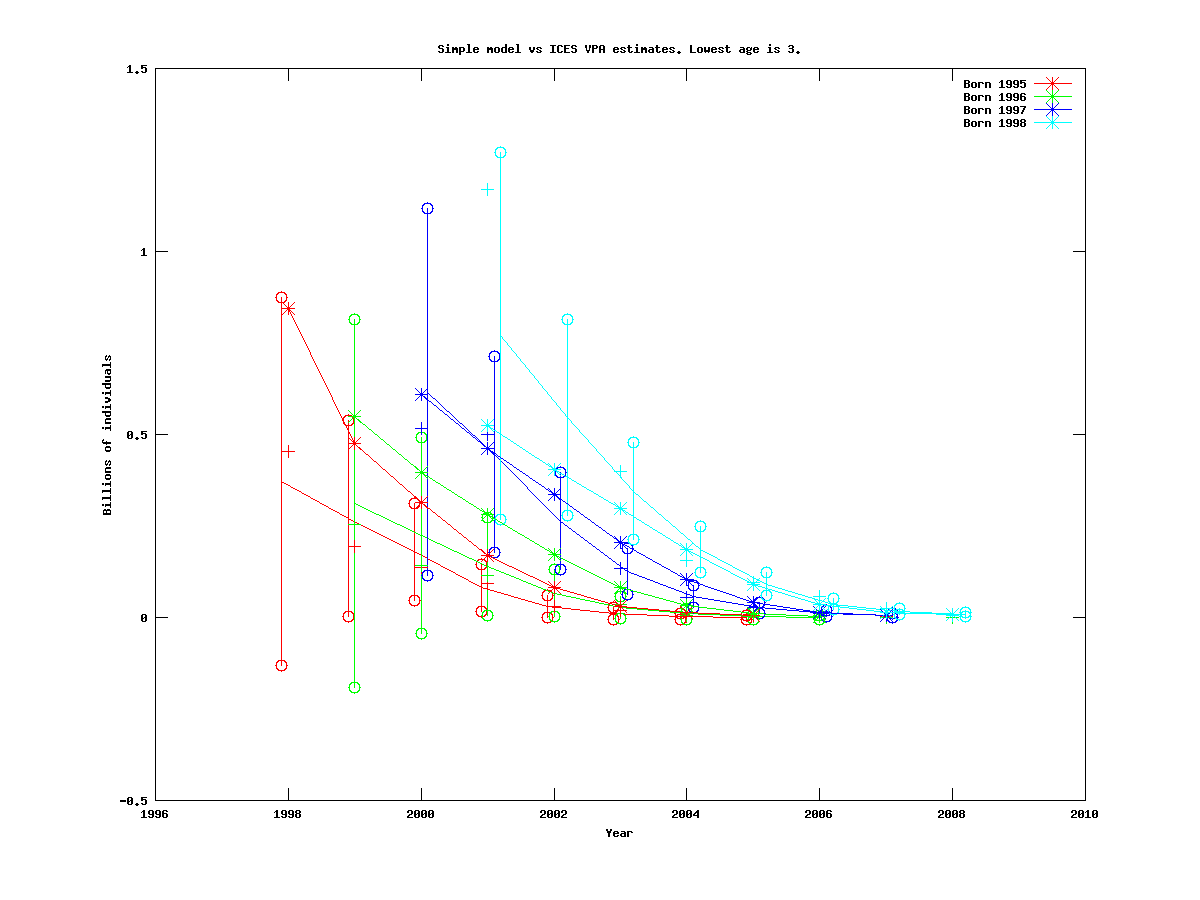
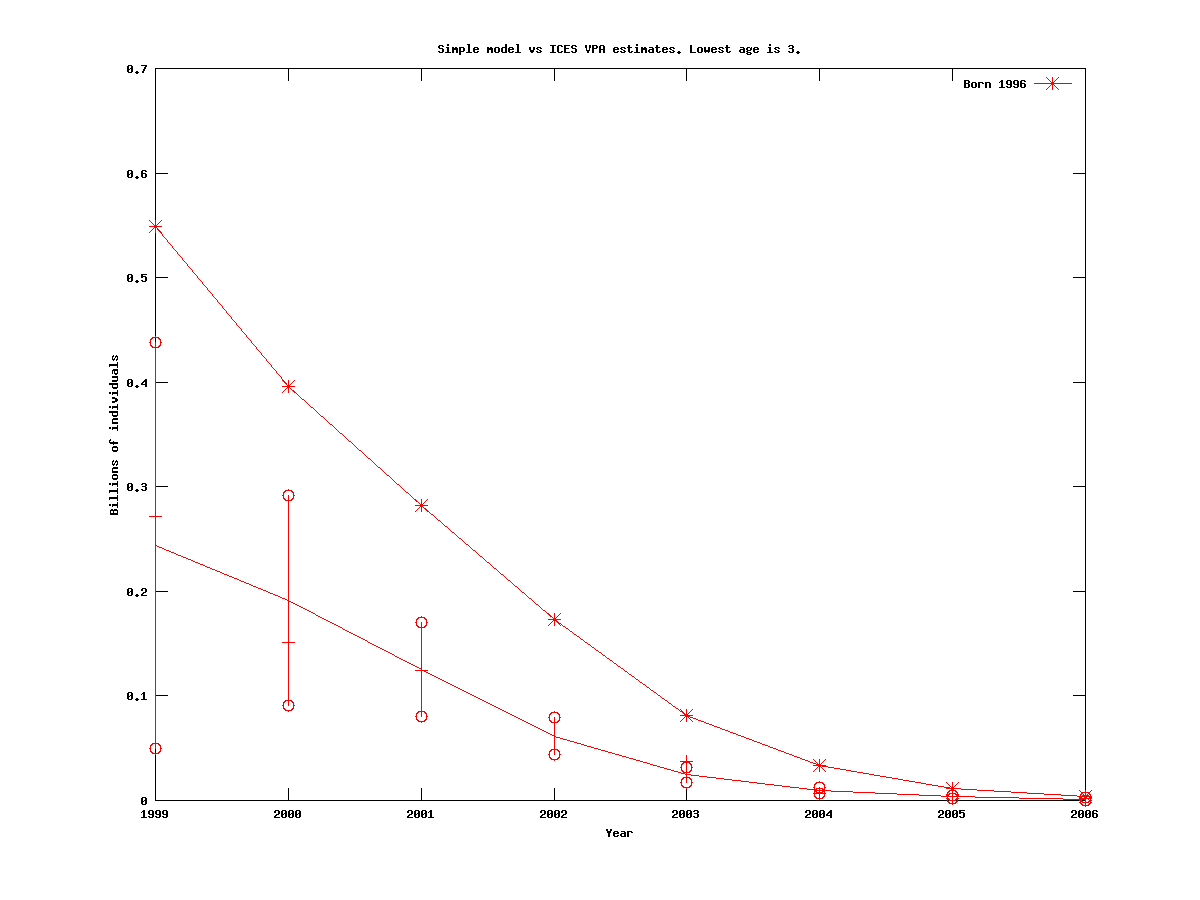
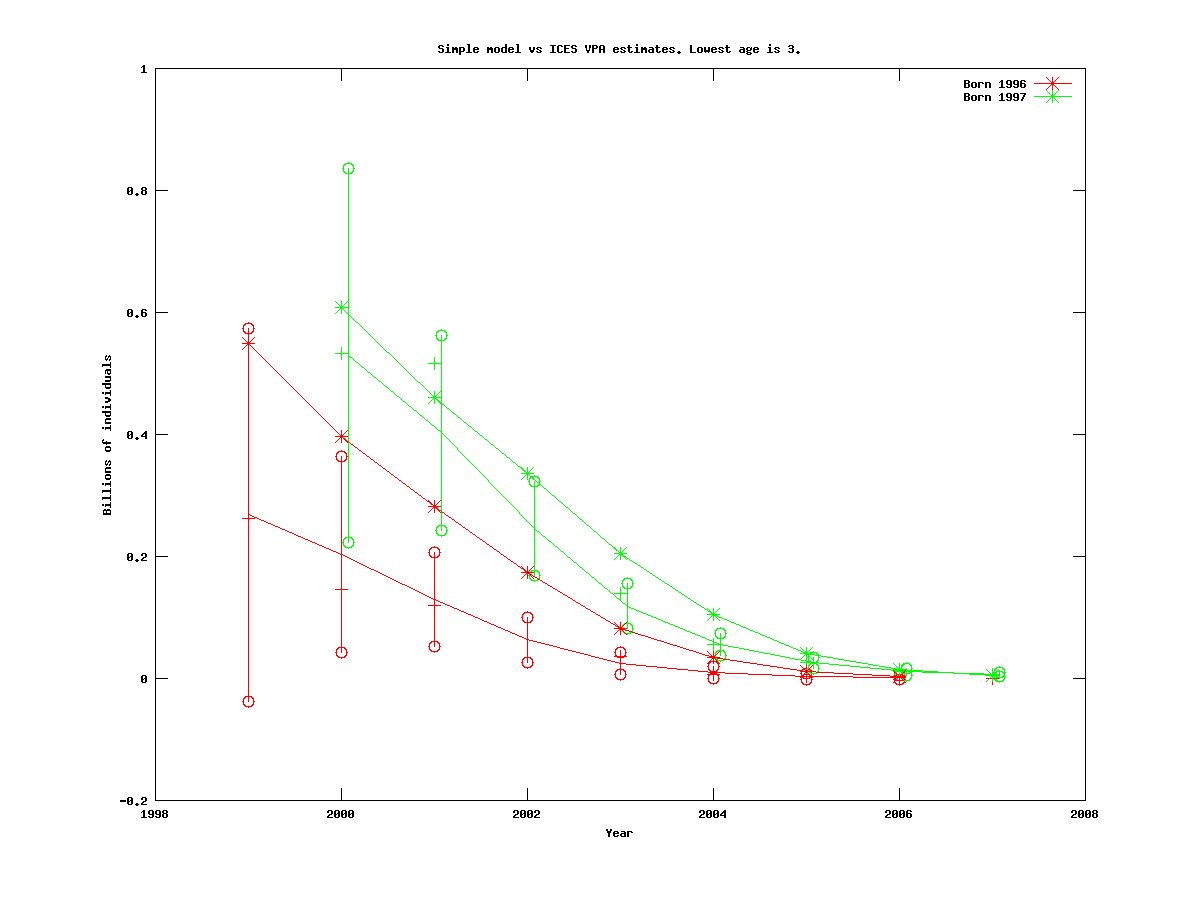
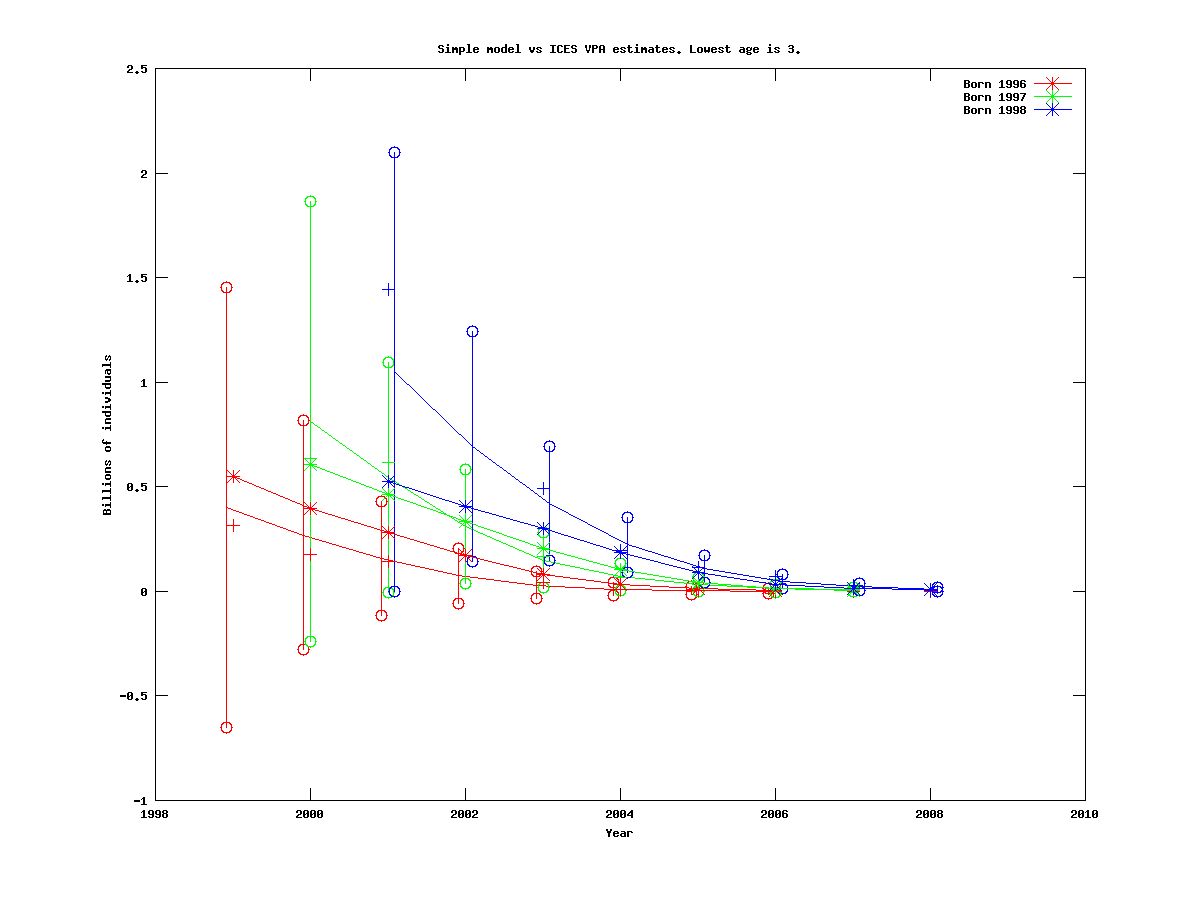
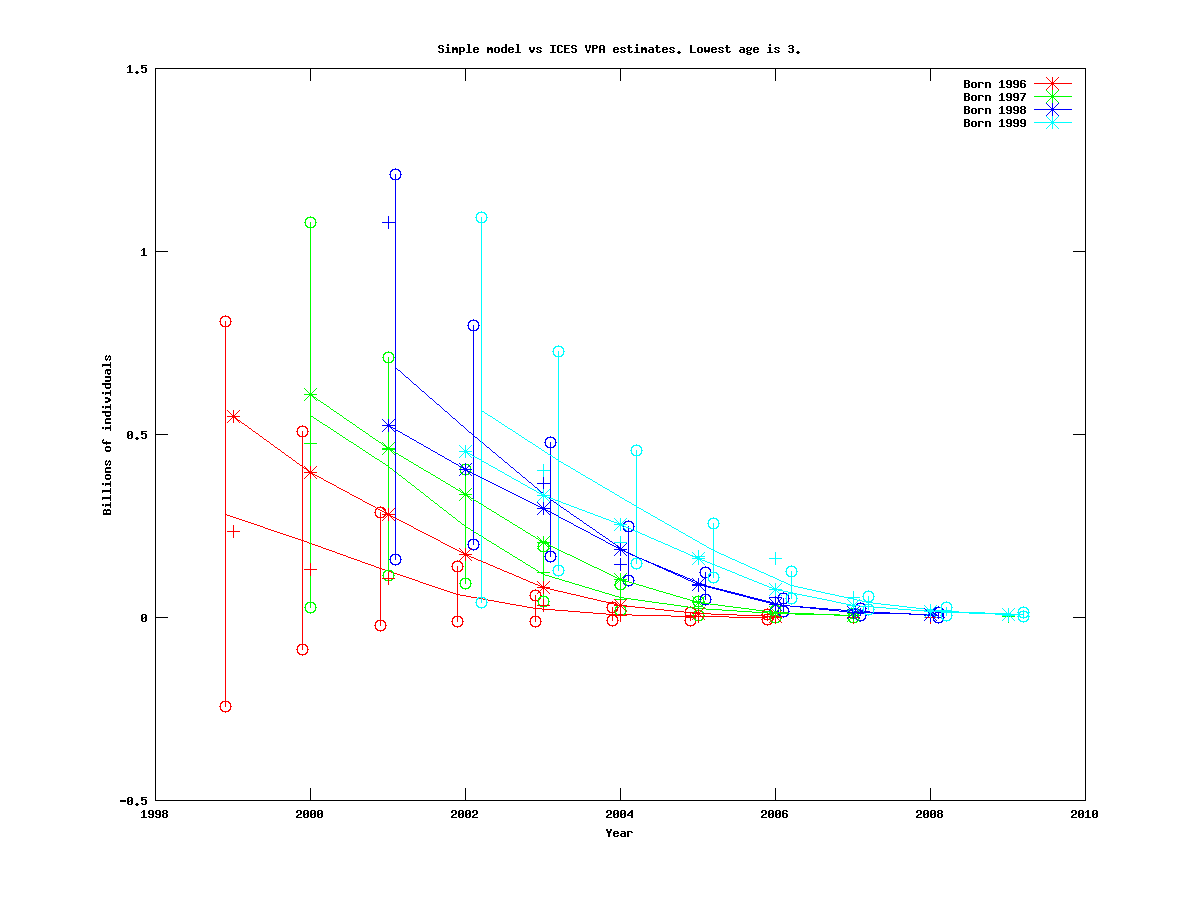
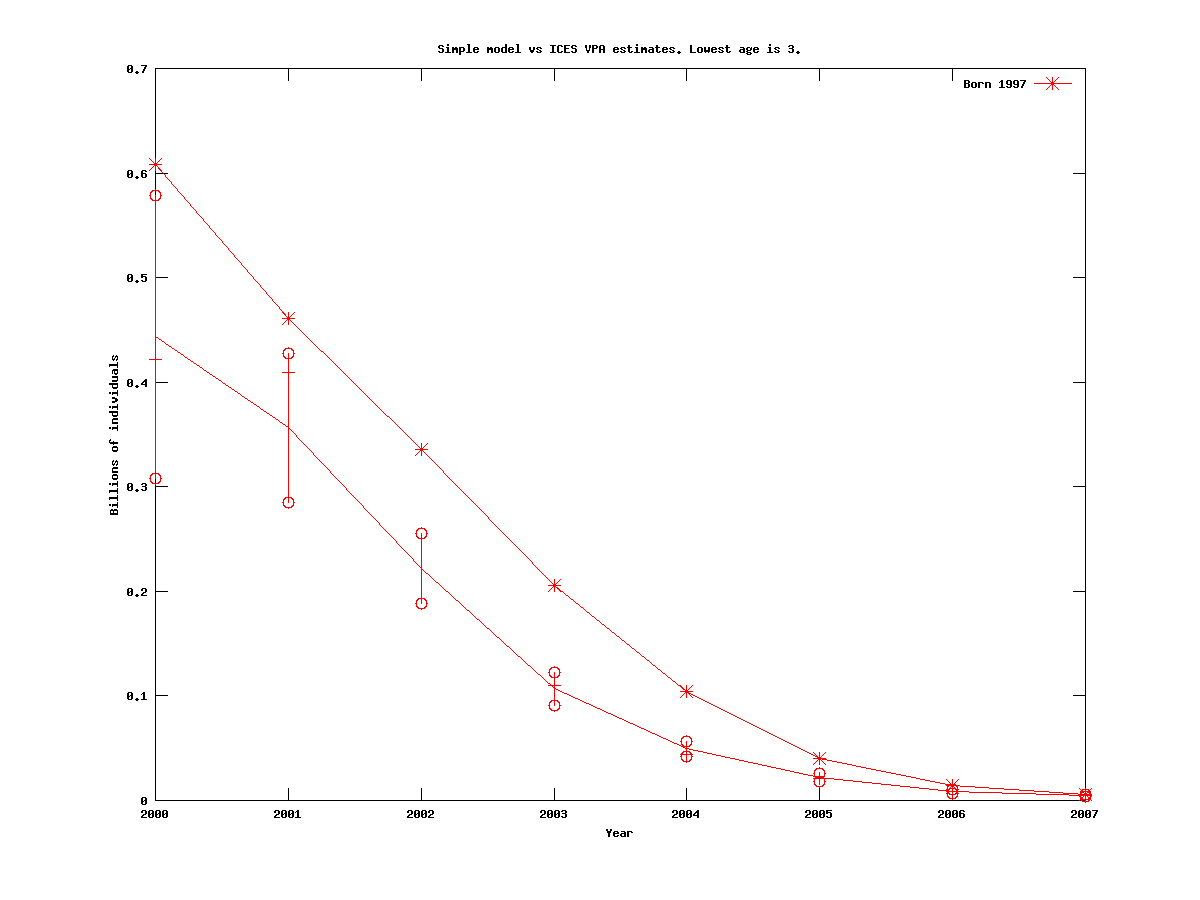
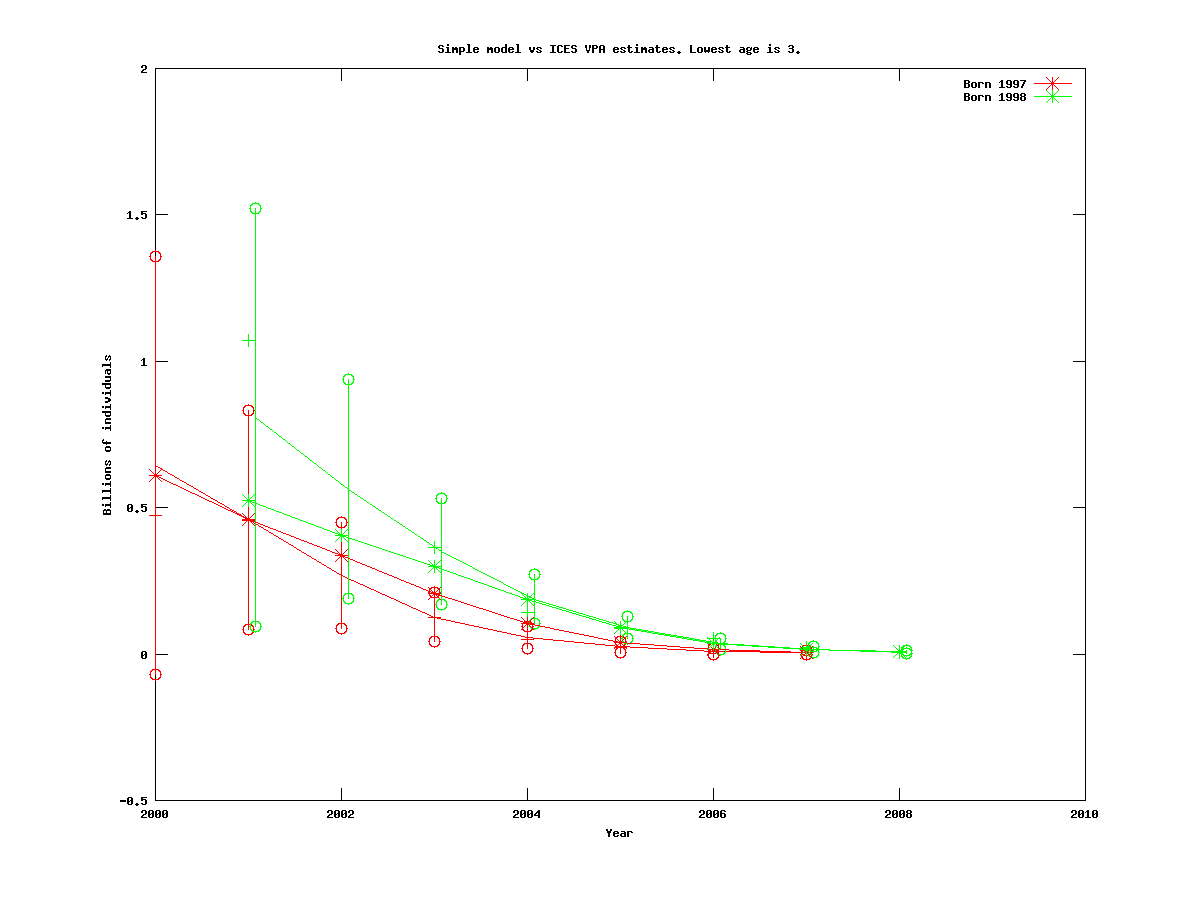
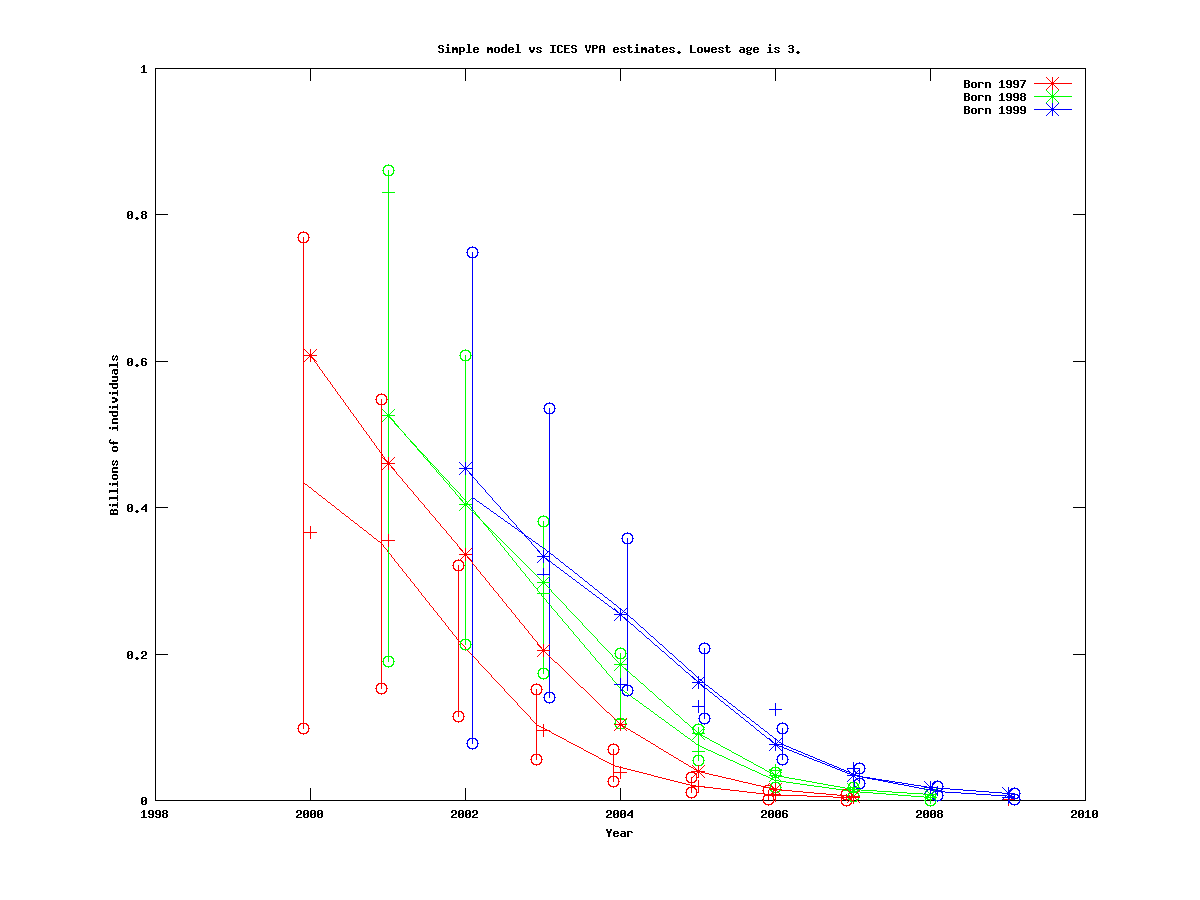
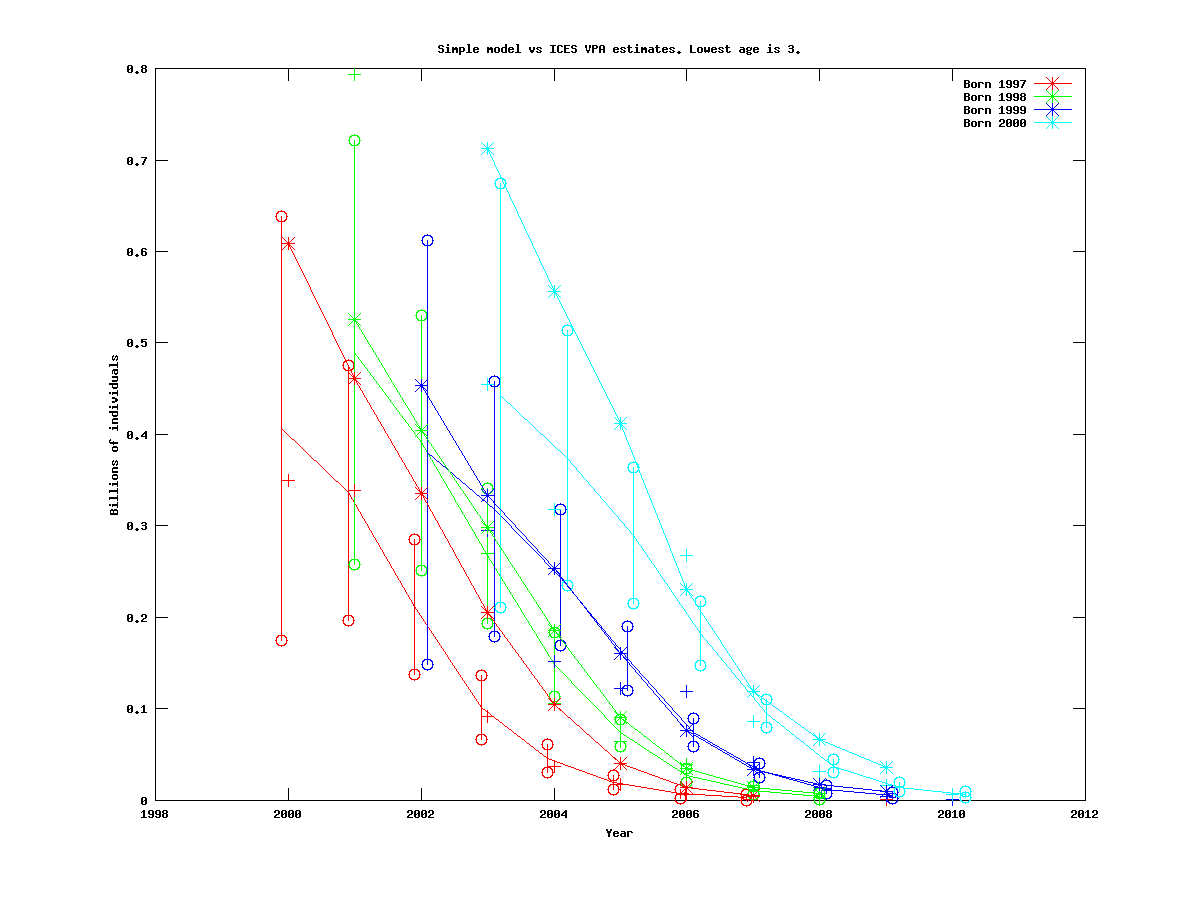
FIXME The plots in this section contain the following errors:

  • The labels on the x-axis and the legend are three years older than they should be. (E.g. if it says 1997 it should be 1994.)
  • The VPA plots (solid lines with stars) are of the wrong cohorts and should be disregarded.

In this section we repeat the experiments of the model estimating only 3 year olds and older, with the difference being that the survey indices which are smaller in magnitude than subsequent indices for the same cohort are deleted.

This experiment is similar to this experiment for the model with two catchabilities.

Summary

:!: The estimates for this experiments are much more consistent than for the experiments with nonmonotone survey data. However, they are also usually lower, as can be seen by comparing the following table with the corresponding table here.

N3birthyear N31994 N31995 N31996 N31997 N31998 N31999 N32000
Single estimate 0.516109 0.289033 0.243818 0.443256
Multiple estimates 0.513446 0.298678
0.509808 0.297279 0.250449
0.504020 0.294245 0.247969 0.484308
0.286587 0.241295
0.293470 0.247051 0.483911
0.371853 0.311810 0.615438 0.769912
0.268437 0.529506
0.401105 0.812412 1.04852
0.281835 0.552476 0.683516 0.566695
0.645252 0.809032
0.433931 0.524806 0.413599
0.406884 0.489518 0.380431 0.442819

First cohort born 1994

Num. cohorts Trajectories Estimates
1
cod.par
# Number of parameters = 4  Objective function value = -3.37978  Maximum gradient component = 1.95145e-06
# N0:
 0.516109
# q:
 0.475306
# logs:
-0.922473038606
# M:
0.229629359685
 
2
cod.par
# Number of parameters = 5  Objective function value = -7.88727  Maximum gradient component = 3.20101e-06
# N0:
 0.513446 0.298678
# q:
 0.452489
# logs:
-1.02581794259
# M:
0.227541762701
 
3
cod.par
# Number of parameters = 6  Objective function value = -12.6473  Maximum gradient component = 3.05992e-05
# N0:
 0.509808 0.297279 0.250449
# q:
 0.414260
# logs:
-1.07487783663
# M:
0.224407491868
 
4
cod.par
# Number of parameters = 7  Objective function value = -20.4626  Maximum gradient component = 0.000311131
# N0:
 0.504020 0.294245 0.247969 0.484308
# q:
 0.417562
# logs:
-1.20560858664
# M:
0.220722003756
 

First cohort born 1995

Num. cohorts Trajectories Estimates
1
cod.par
# Number of parameters = 4  Objective function value = -4.93278  Maximum gradient component = 6.89035e-06
# N0:
 0.289033
# q:
 0.432621
# logs:
-1.20468309469
# M:
0.214608667980
 
2
cod.par
# Number of parameters = 5  Objective function value = -10.7519  Maximum gradient component = 0.000181244
# N0:
 0.286587 0.241295
# q:
 0.387224
# logs:
-1.26799574237
# M:
0.209539869492
 
3
cod.par
# Number of parameters = 6  Objective function value = -19.7971  Maximum gradient component = 5.18349e-05
# N0:
 0.293470 0.247051 0.483911
# q:
 0.392993
# logs:
-1.44271797754
# M:
0.218665452260
 
4
cod.par
# Number of parameters = 7  Objective function value = -22.5567  Maximum gradient component = 3.07576e-05
# N0:
 0.371853 0.311810 0.615438 0.769912
# q:
 0.365359
# logs:
-1.30559636690
# M:
0.302854166936
 

First cohort born 1996

Num. cohorts Trajectories Estimates
1
cod.par
# Number of parameters = 4  Objective function value = -6.96424  Maximum gradient component = 2.89220e-05
# N0:
 0.243818
# q:
 0.341766
# logs:
-1.49489079550
# M:
0.211927949874
 
2
cod.par
# Number of parameters = 5  Objective function value = -16.5870  Maximum gradient component = 7.50474e-05
# N0:
 0.268437 0.529506
# q:
 0.353662
# logs:
-1.68478868950
# M:
0.248314995512
 
3
cod.par
# Number of parameters = 6  Objective function value = -18.1745  Maximum gradient component = 2.66569e-05
# N0:
 0.401105 0.812412 1.04852
# q:
 0.296806
# logs:
-1.36545147740
# M:
0.384113190246
 
4
cod.par
# Number of parameters = 7  Objective function value = -21.8712  Maximum gradient component = 6.70988e-06
# N0:
 0.281835 0.552476 0.683516 0.566695
# q:
 0.396672
# logs:
-1.28111344656
# M:
0.267739682105
 

First cohort born 1997

Num. cohorts Trajectories Estimates
1
cod.par
# Number of parameters = 4  Objective function value = -14.9417  Maximum gradient component = 0.000156633
# N0:
 0.443256
# q:
 0.446373
# logs:
-2.63452610841
# M:
0.188376555429
 
2
cod.par
# Number of parameters = 5  Objective function value = -13.6729  Maximum gradient component = 2.55368e-05
# N0:
 0.645252 0.809032
# q:
 0.398800
# logs:
-1.47663242459
# M:
0.322592116138
 
3
cod.par
# Number of parameters = 6  Objective function value = -17.8498  Maximum gradient component = 1.24022e-05
# N0:
 0.433931 0.524806 0.413599
# q:
 0.514941
# logs:
-1.34998941565
# M:
0.182910597292
 
4
cod.par
# Number of parameters = 7  Objective function value = -25.7355  Maximum gradient component = 0.000543041
# N0:
 0.406884 0.489518 0.380431 0.442819
# q:
 0.539011
# logs:
-1.41912547614
# M:
0.157823692174
 
admb_real/n3_cohorts_per_run_monotonic.txt · Last modified: 2010/10/20 13:24 by lennartfr