User Tools

Site Tools


admb_real:n3_cohorts_per_run

Model estimating only 3 year olds and older

In this section we test a model which does not use data for 0-2 year olds, and does not estimate these age groups. It is equivalent to the simple model, with the catch and survey data shifted.

We perform the same experiment as for the model with two catchabilities, namely trying out different numbers of cohorts which are to be estimated at the same time.

Summary

:!: :!: Unlike for the experiments with the model with two catchabilities, the parameter estimates are in general inside their bounds. This means that the computed standard deviations are meaningful.

:!: The estimates are sometimes smaller than the corresponding VPA estimates, and sometimes larger, unlike for the model with two catchabilities, where they were always larger.

:!: There are some issues with stability, especially regarding the number of years we follow a cohort. Although not plotted below, for the experiment with a single cohort born in 1994, it makes a huge difference whether we follow it for 6 or 7 years.

:!: As more cohorts are added the population sizes at age 3 become more stable, but not always at the levels estimated when only following a single cohort. This can be seen in the following table:

N3birthyear N31994 N31995 N31996 N31997 N31998 N31999 N32000
Single estimate 0.516109 0.364052 0.343280 0.893856
Multiple estimates 0.803846 0.413922
0.628584 0.362537 0.300540
0.622791 0.359443 0.298084 0.589102
0.369516 0.306418
0.381369 0.316046 0.631374
0.437240 0.361336 0.727927 0.930341
0.405056 0.840858
0.503421 1.07145 1.43532
0.297859 0.590654 0.738234 0.622872
0.900099 1.17791
0.389587 0.467355 0.360528
0.395227 0.474633 0.367218 0.426952

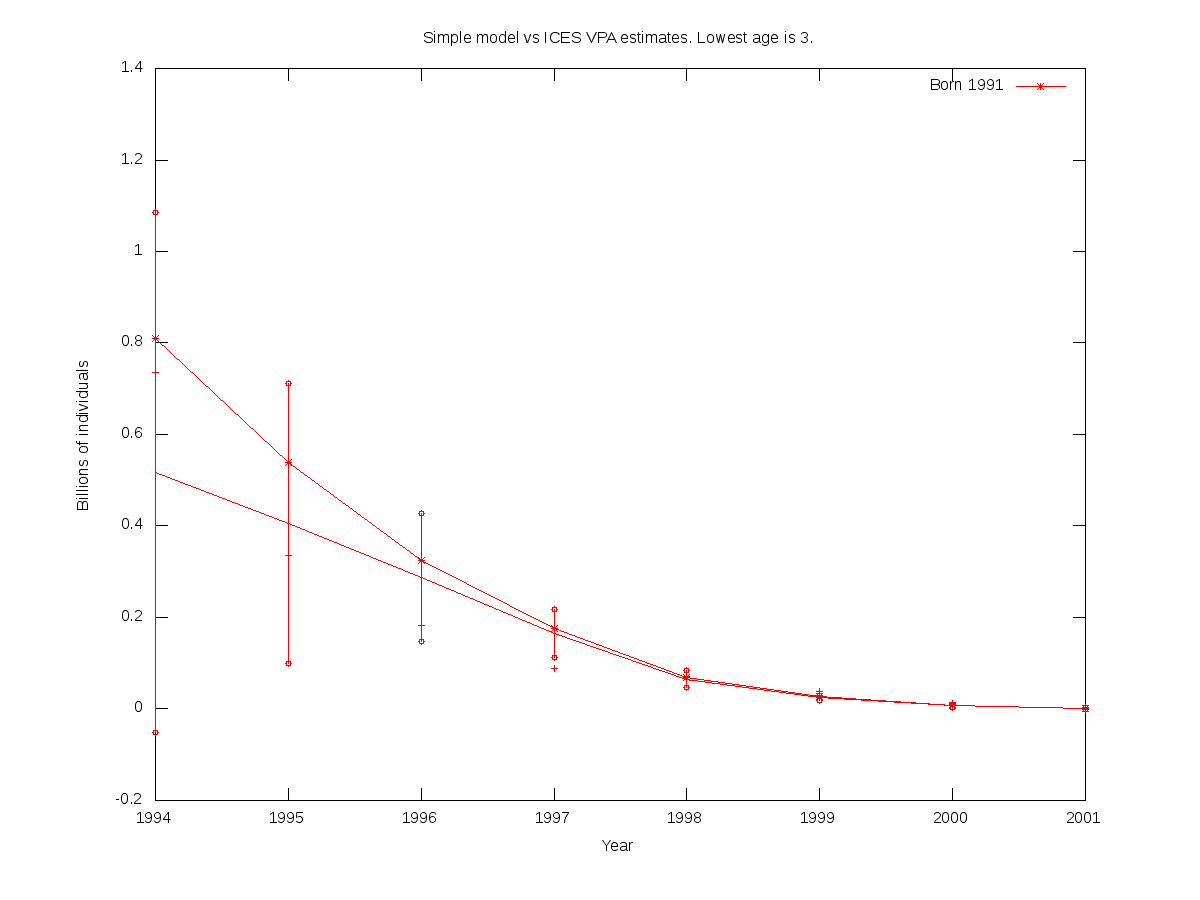
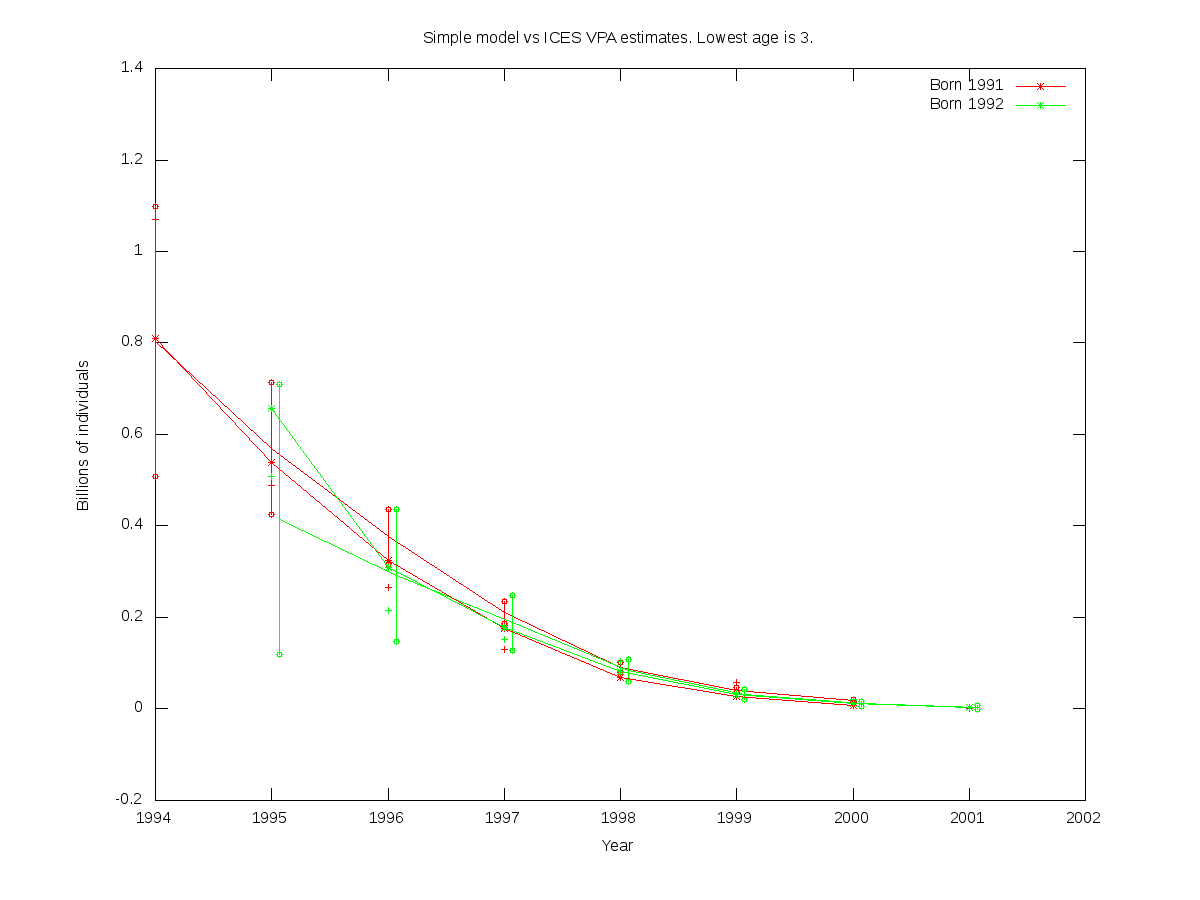
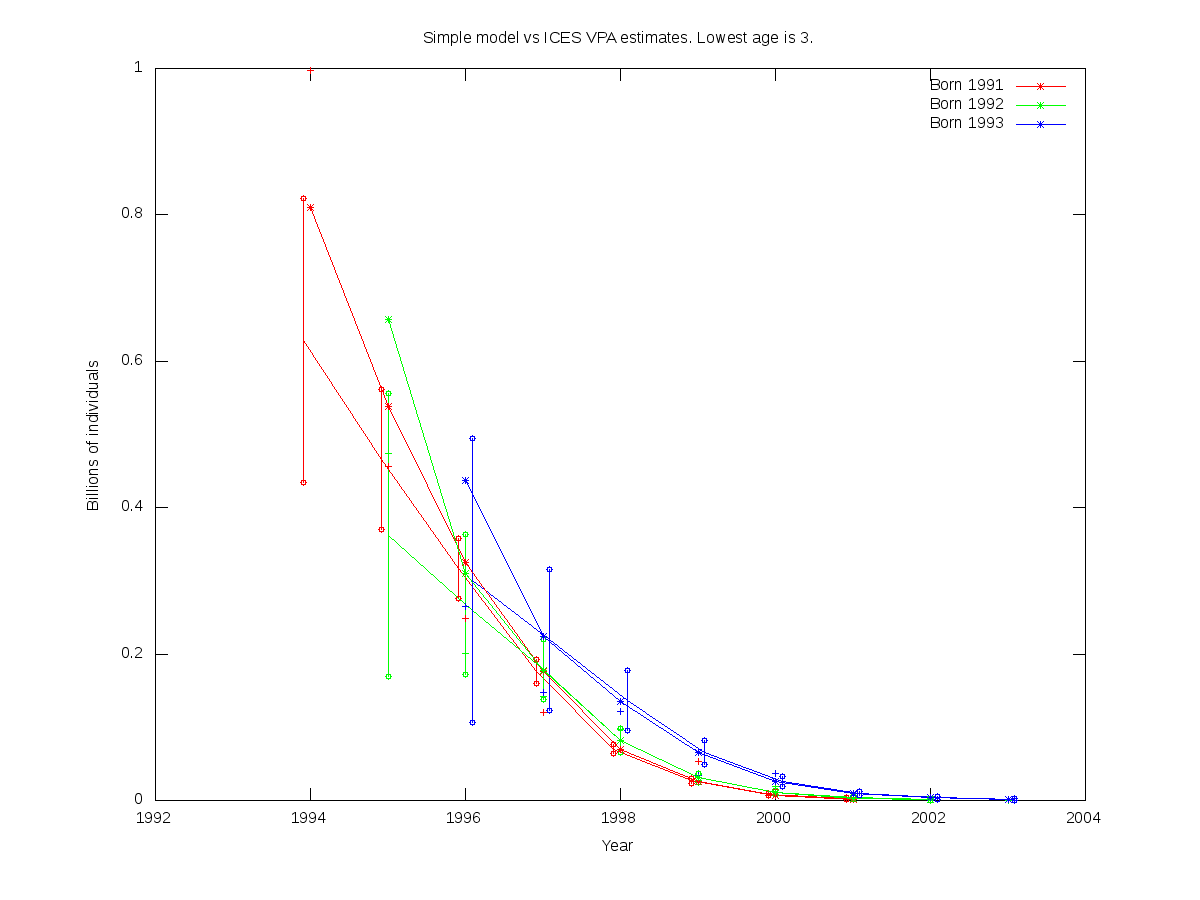
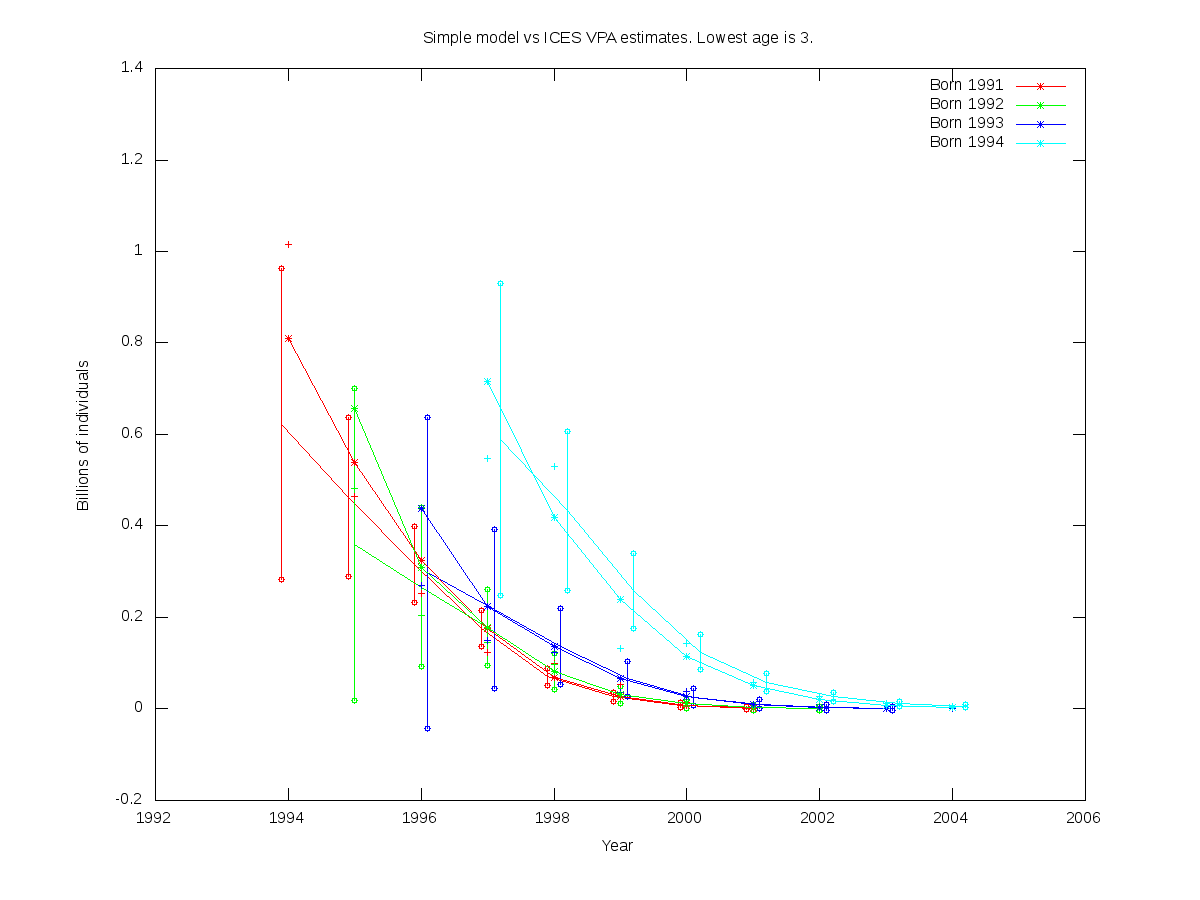
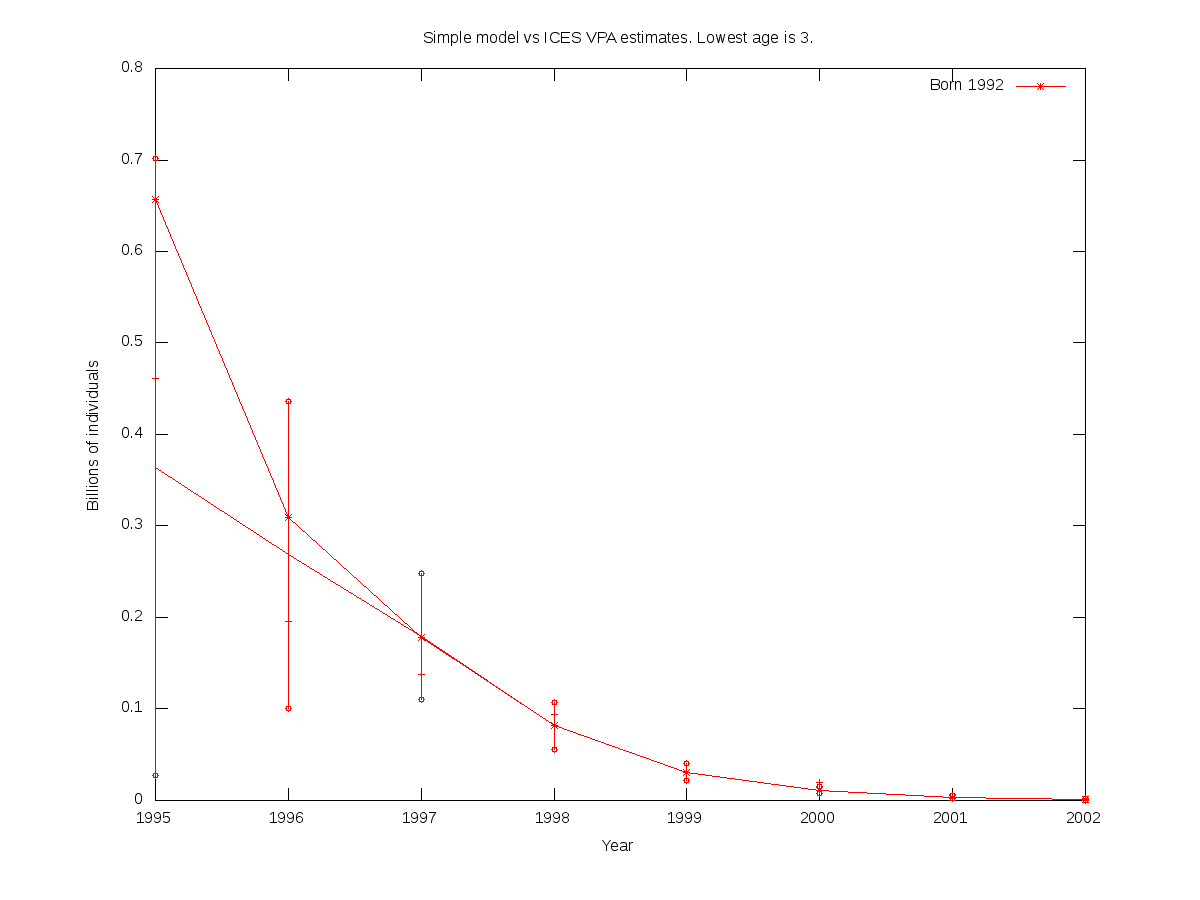
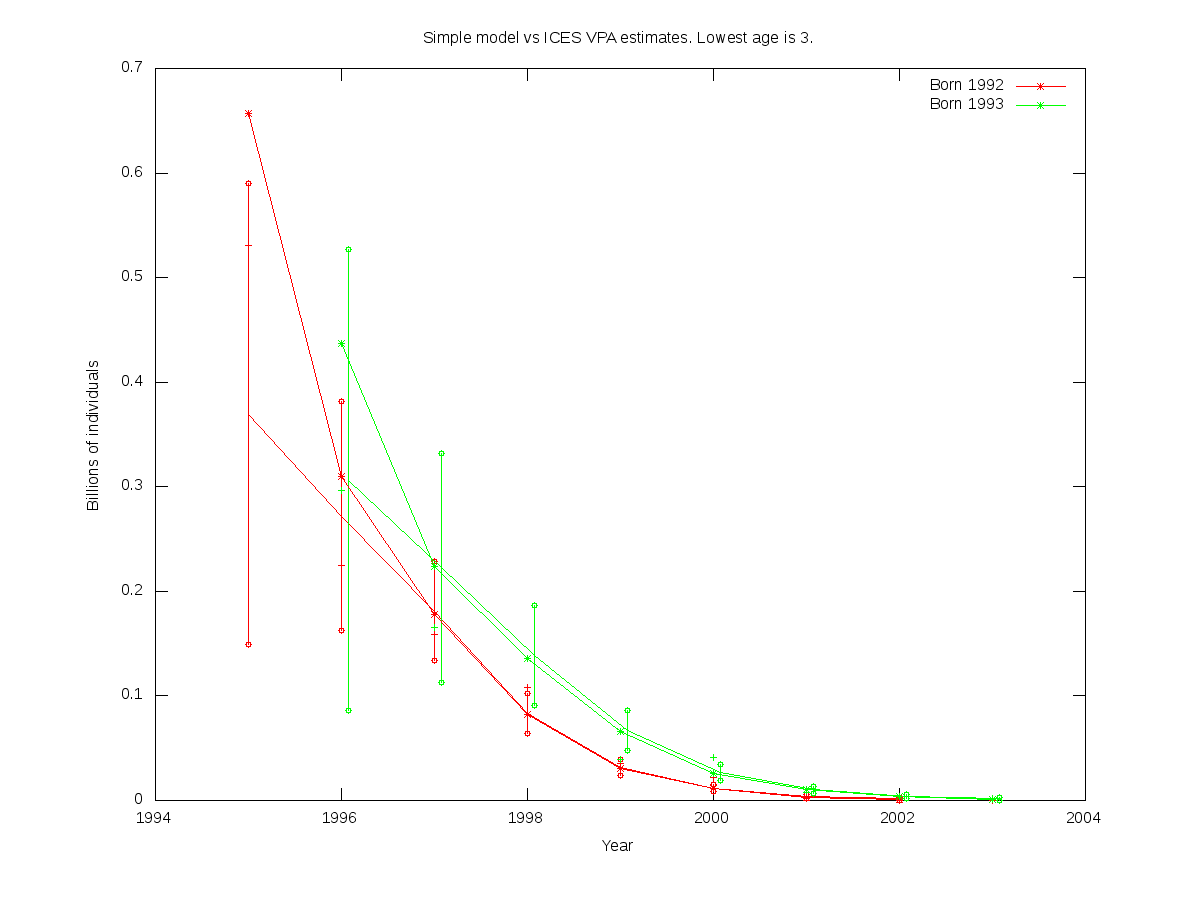
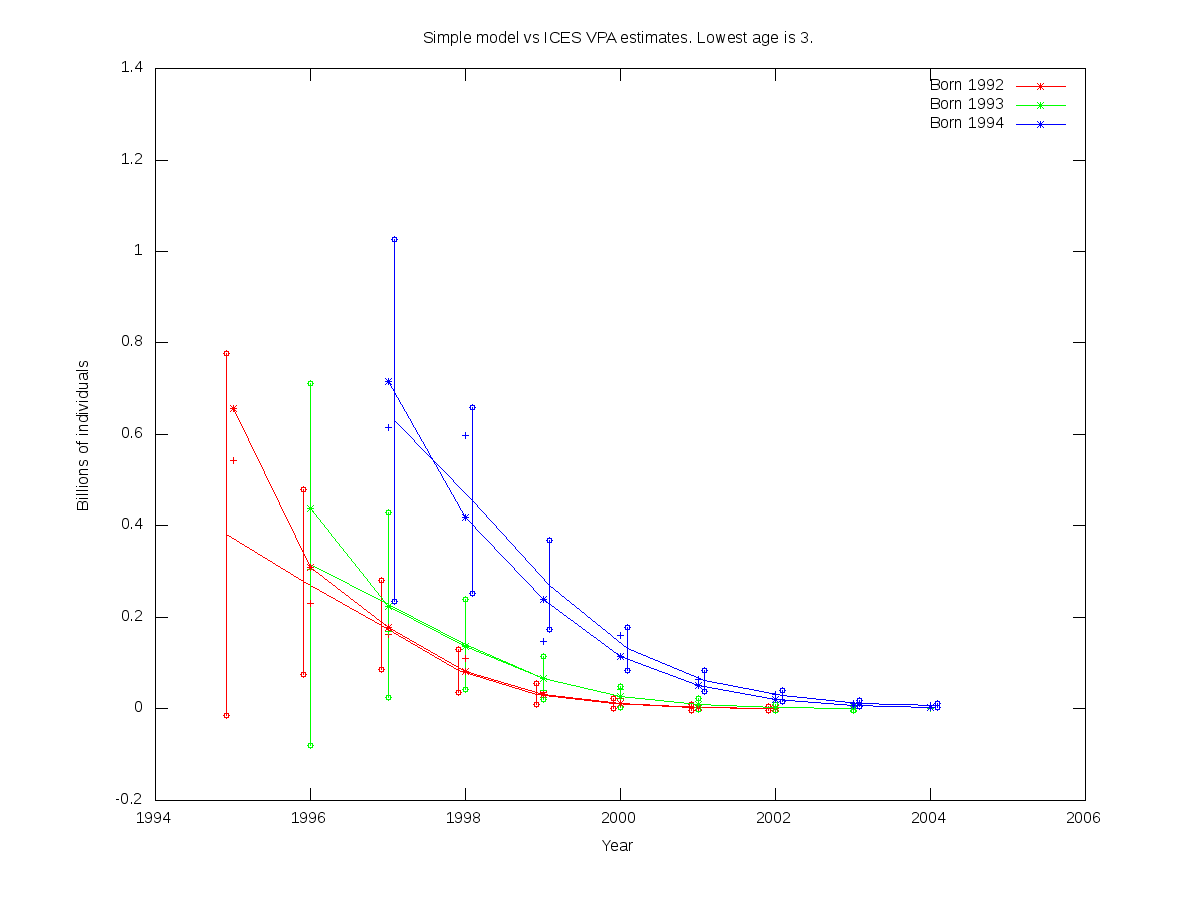
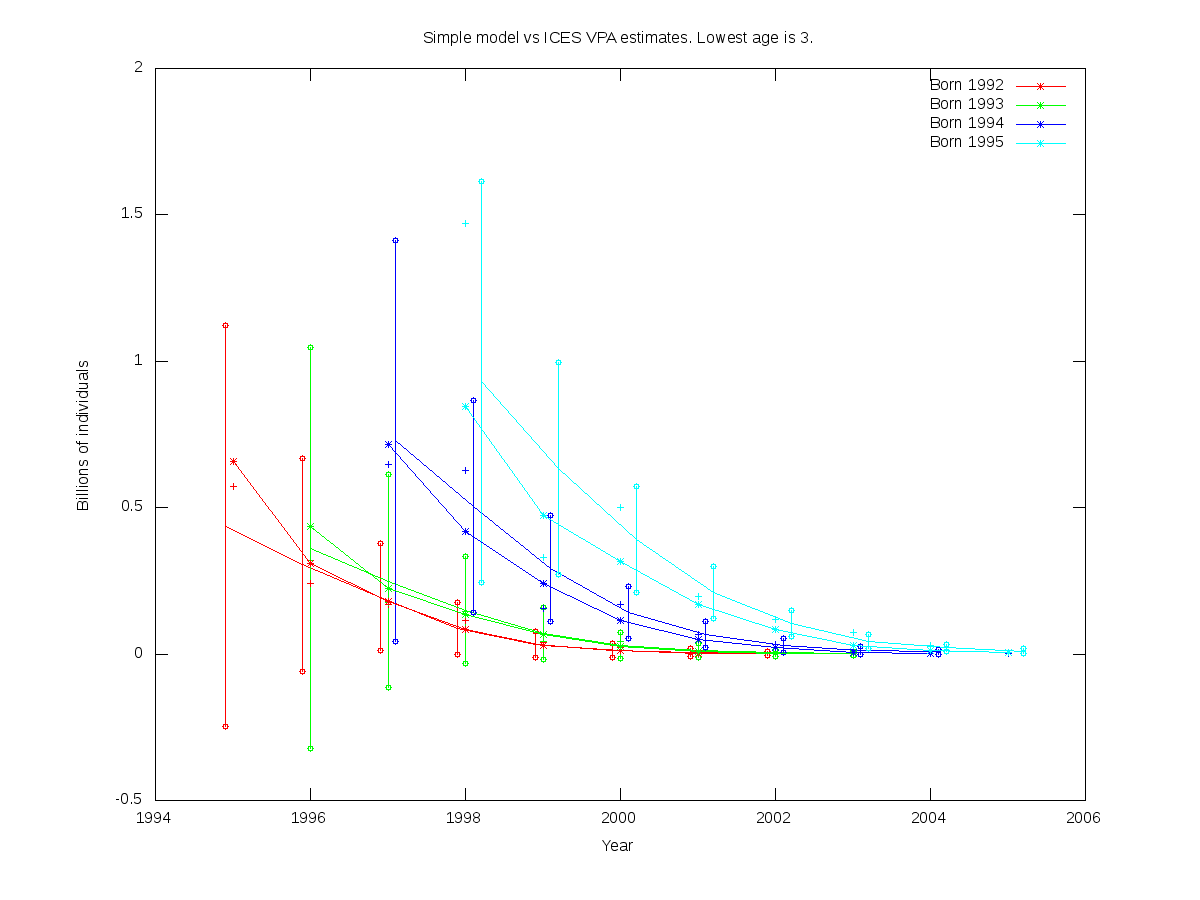
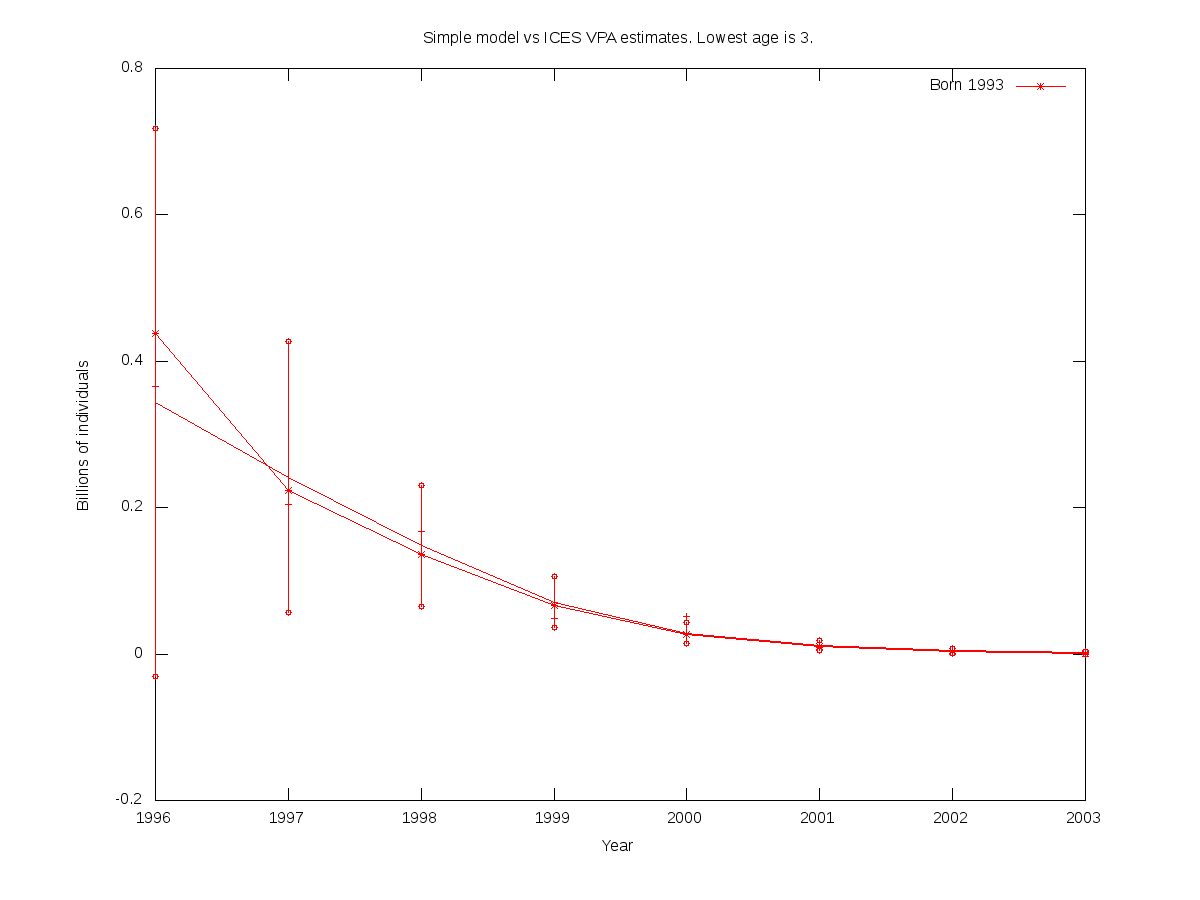
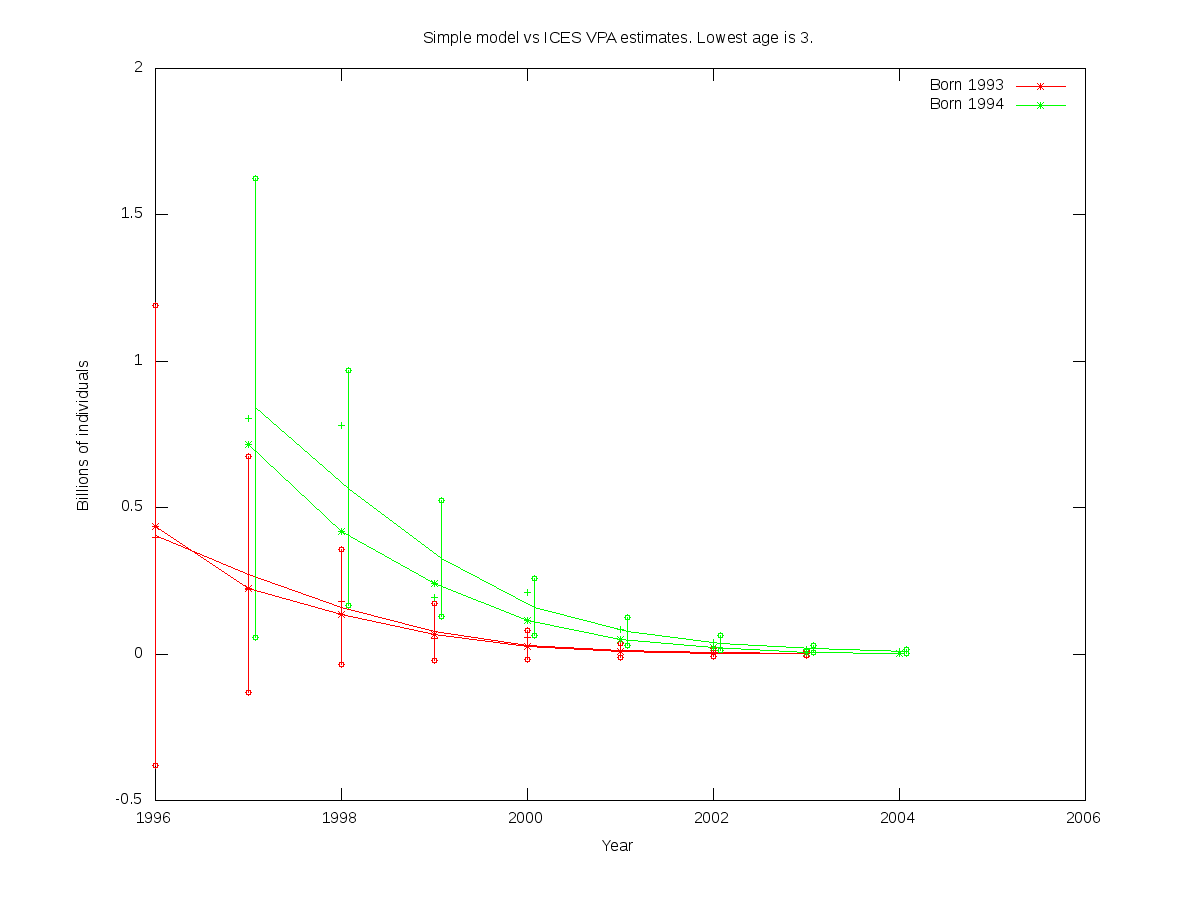
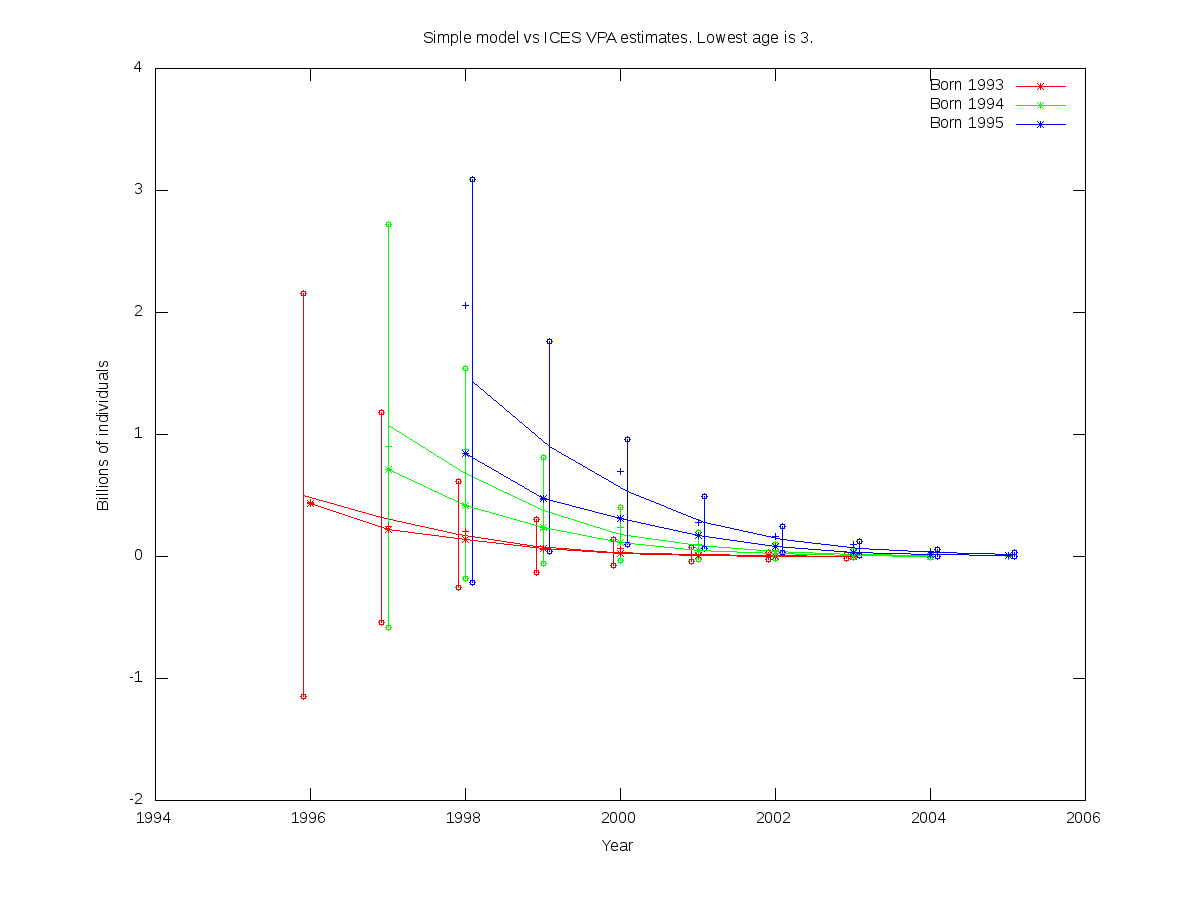
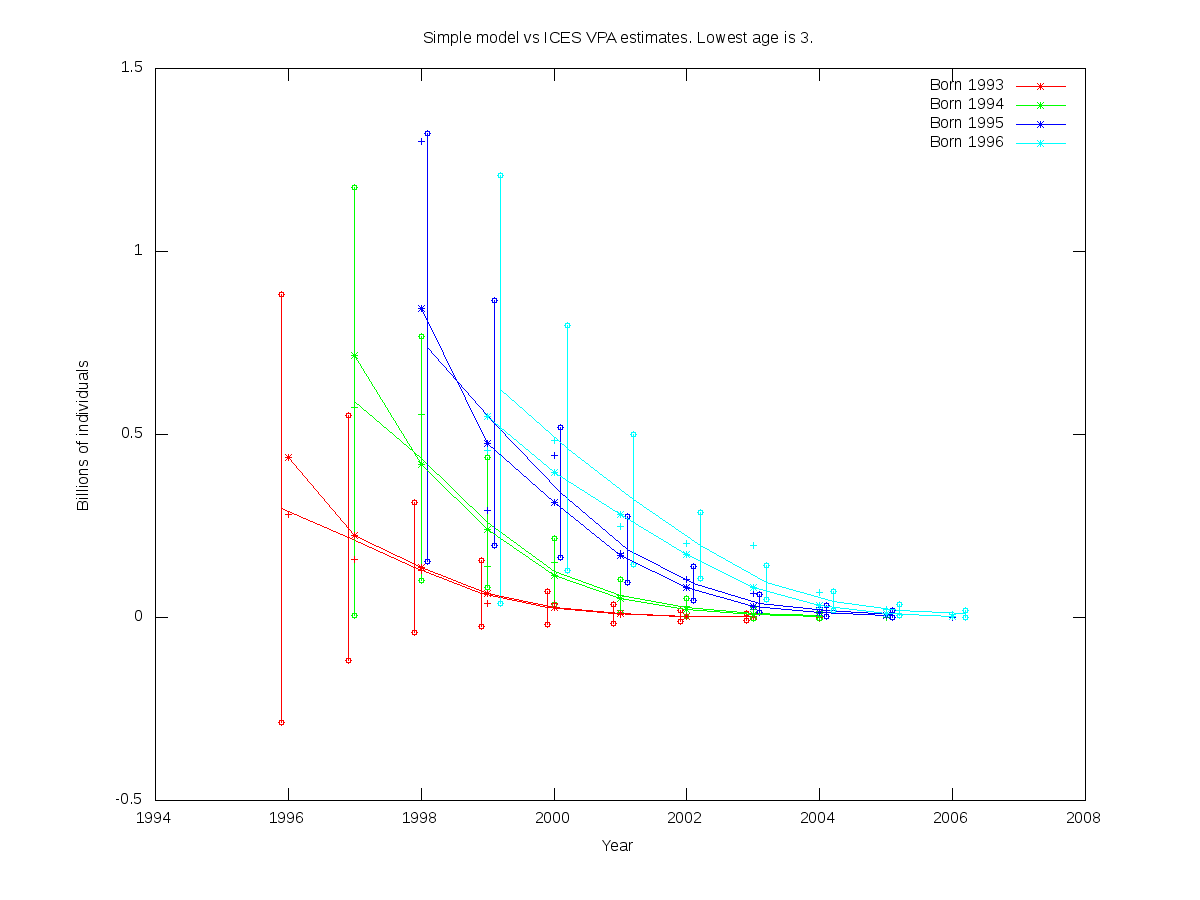
First cohort born 1994

:!: NOTE Although the population variables are called N0, they represent the population level at age 3.

:!: The run with two cohorts did not converge when the maximum age was set to 10, so is set to 9.

Num. cohorts Trajectories Estimates
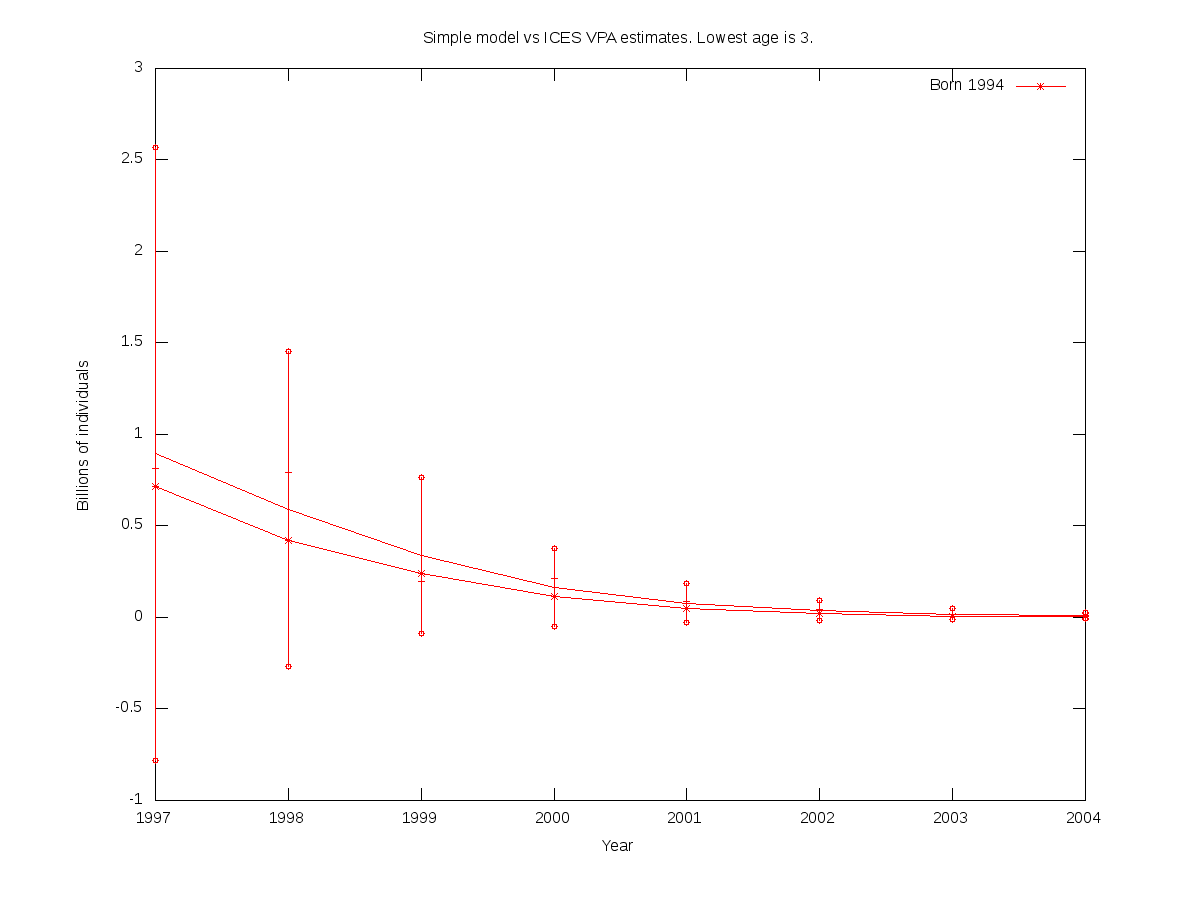
1
cod.par
# Number of parameters = 4  Objective function value = -3.37978  Maximum gradient component = 1.95145e-06
# N0:
 0.516109
# q:
 0.475306
# logs:
-0.922473038606
# M:
0.229629359685
 
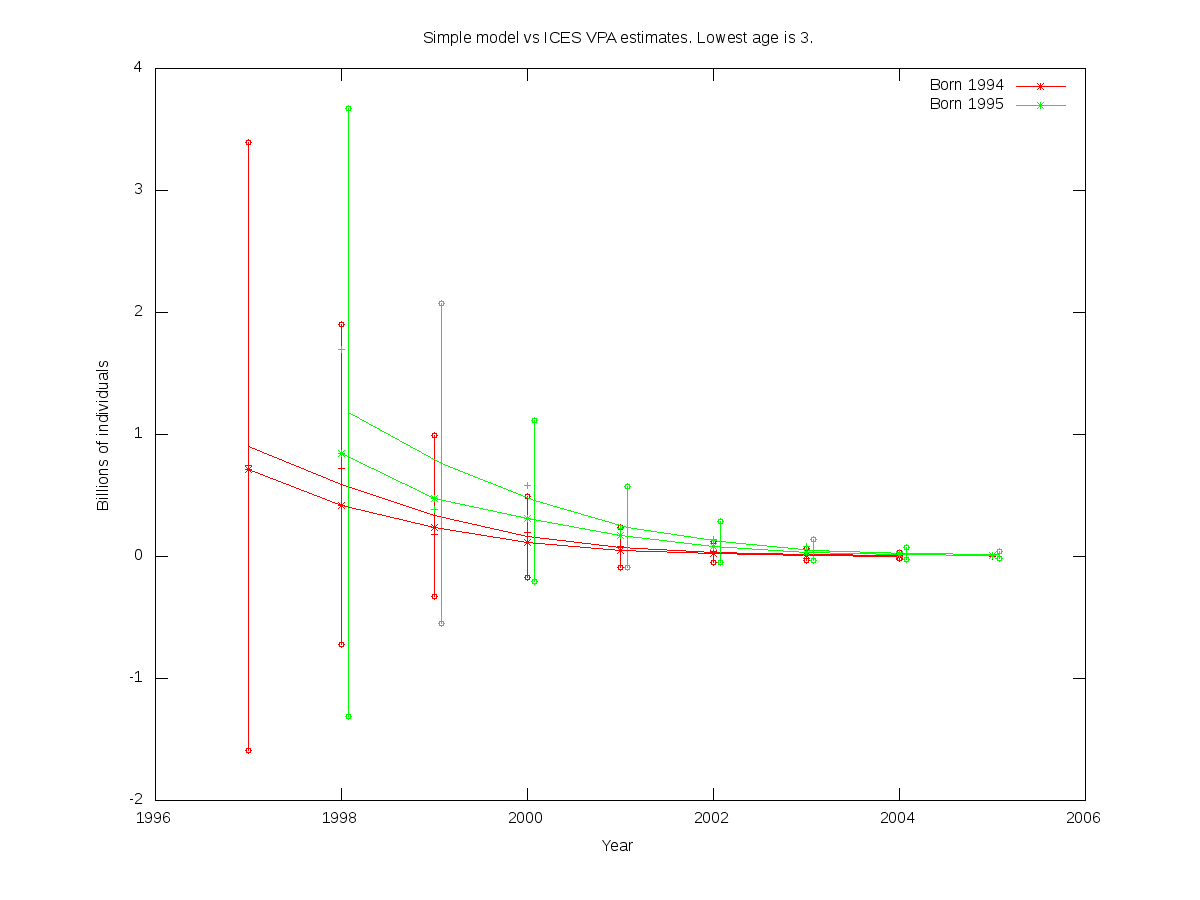
2
cod.par
# Number of parameters = 5  Objective function value = -9.55295  Maximum gradient component = 2.32779e-05
# N0:
 0.803846 0.413922
# q:
 0.327094
# logs:
-1.18235361737
# M:
0.336813802520
 
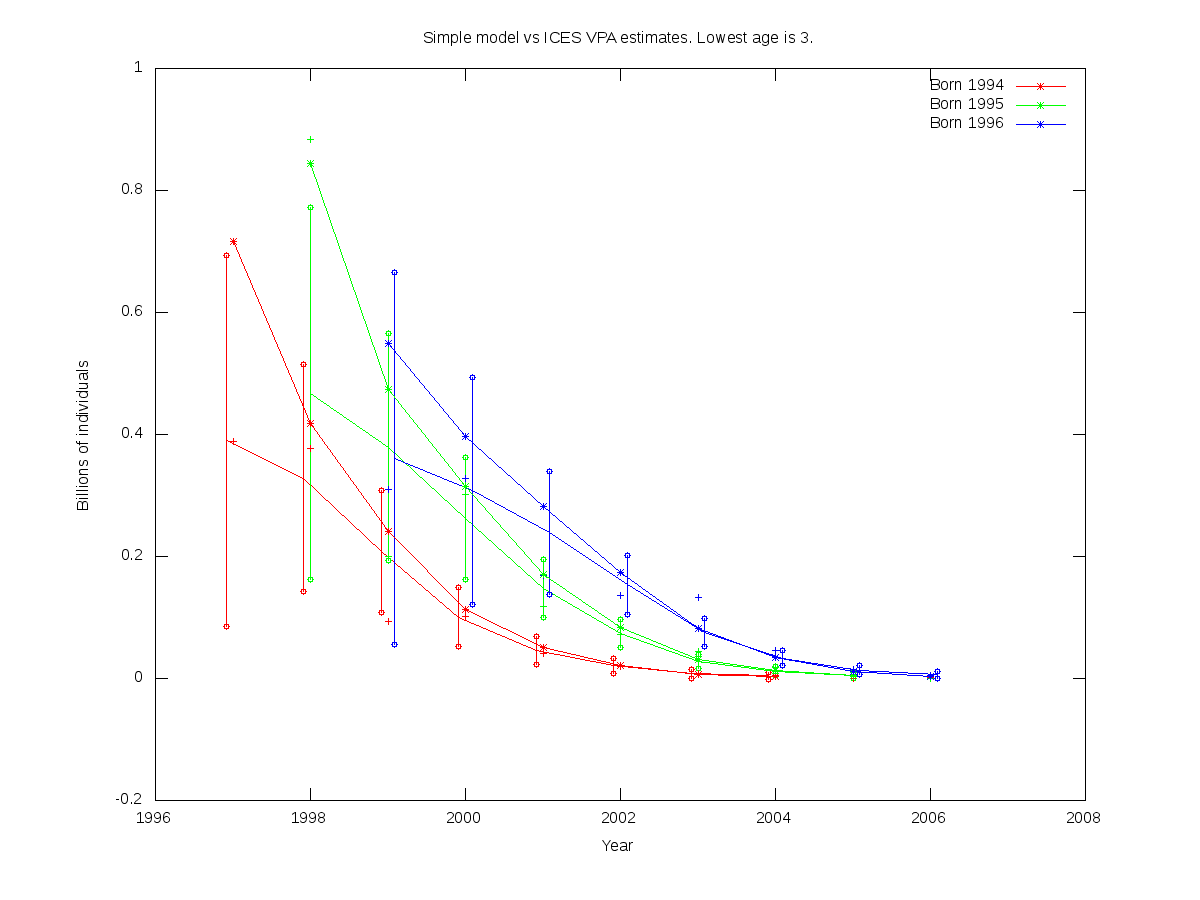
3
cod.par
# Number of parameters = 6  Objective function value = -12.5230  Maximum gradient component = 7.21299e-05
# N0:
 0.628584 0.362537 0.300540
# q:
 0.350674
# logs:
-1.02179235777
# M:
0.289443475648
 
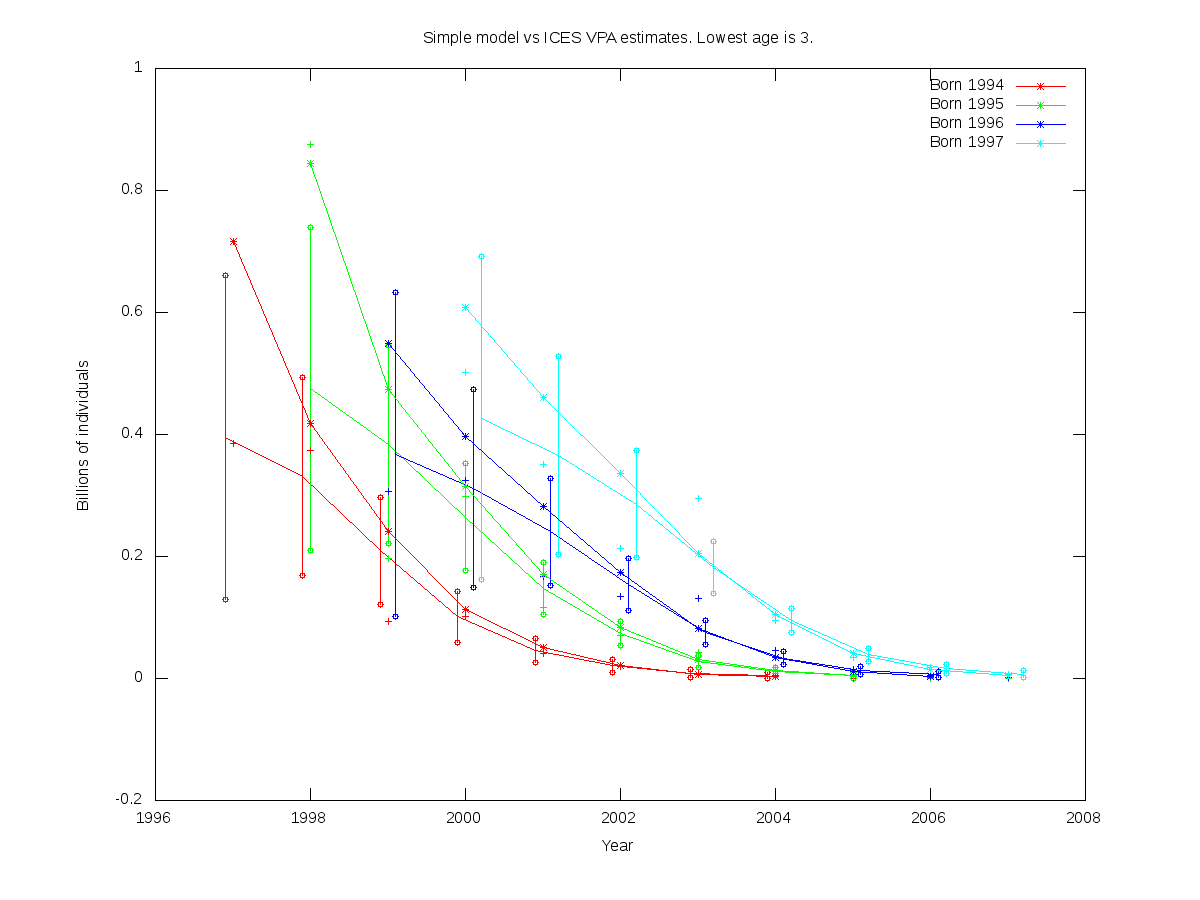
4
cod.par
# Number of parameters = 7  Objective function value = -18.7801  Maximum gradient component = 0.000328611
# N0:
 0.622791 0.359443 0.298084 0.589102
# q:
 0.344332
# logs:
-1.08687795940
# M:
0.286208904677
 

First cohort born 1995

:!: NOTE Although the population variables are called N0, they represent the population level at age 3.

Num. cohorts Trajectories Estimates
1
cod.par
# Number of parameters = 4  Objective function value = -5.59638  Maximum gradient component = 7.74232e-05
# N0:
 0.364052
# q:
 0.360699
# logs:
-1.19954713216
# M:
0.291272410377
 
2
cod.par
# Number of parameters = 5  Objective function value = -10.9818  Maximum gradient component = 6.07228e-05
# N0:
 0.369516 0.306418
# q:
 0.313287
# logs:
-1.18636245551
# M:
0.294287629410
 
3
cod.par
# Number of parameters = 6  Objective function value = -17.9526  Maximum gradient component = 4.47329e-05
# N0:
 0.381369 0.316046 0.631374
# q:
 0.305620
# logs:
-1.24802508061
# M:
0.304658857253
 
4
cod.par
# Number of parameters = 7  Objective function value = -19.9411  Maximum gradient component = 3.61072e-05
# N0:
 0.437240 0.361336 0.727927 0.930341
# q:
 0.290922
# logs:
-1.12315927867
# M:
0.349501204632
 

First cohort born 1996

:!: NOTE Although the population variables are called N0, they represent the population level at age 3.

Num. cohorts Trajectories Estimates
1
cod.par
# Number of parameters = 4  Objective function value = -6.57862  Maximum gradient component = 3.41763e-05
# N0:
 0.343280
# q:
 0.253697
# logs:
-1.32232734466
# M:
0.328278664602
 
2
cod.par
# Number of parameters = 5  Objective function value = -13.7544  Maximum gradient component = 3.38158e-06
# N0:
 0.405056 0.840858
# q:
 0.233947
# logs:
-1.35965206122
# M:
0.380156075941
 
3
cod.par
# Number of parameters = 6  Objective function value = -15.2285  Maximum gradient component = 5.62207e-05
# N0:
 0.503421 1.07145 1.43532
# q:
 0.208151
# logs:
-1.13451875040
# M:
0.443069717196
 
4
cod.par
# Number of parameters = 7  Objective function value = -18.8363  Maximum gradient component = 8.67845e-05
# N0:
 0.297859 0.590654 0.738234 0.622872
# q:
 0.328860
# logs:
-1.08863375308
# M:
0.285142576059
 

First cohort born 1997

:!: NOTE Although the population variables are called N0, they represent the population level at age 3.

Num. cohorts Trajectories Estimates
1
cod.par
# Number of parameters = 4  Objective function value = -7.30997  Maximum gradient component = 5.91774e-06
# N0:
 0.893856
# q:
 0.230683
# logs:
-1.41374631937
# M:
0.397902182138
 
2
cod.par
# Number of parameters = 5  Objective function value = -9.22716  Maximum gradient component = 2.99965e-06
# N0:
 0.900099 1.17791
# q:
 0.252102
# logs:
-1.07669731352
# M:
0.407261698083
 
3
cod.par
# Number of parameters = 6  Objective function value = -14.2602  Maximum gradient component = 0.000175596
# N0:
 0.389587 0.467355 0.360528
# q:
 0.483771
# logs:
-1.09417574178
# M:
0.138538549318
 
4
cod.par
# Number of parameters = 7  Objective function value = -21.4434  Maximum gradient component = 0.000408809
# N0:
 0.395227 0.474633 0.367218 0.426952
# q:
 0.488868
# logs:
-1.17010474477
# M:
0.144620261549
 
admb_real/n3_cohorts_per_run.txt · Last modified: 2010/10/27 11:54 by lennartfr