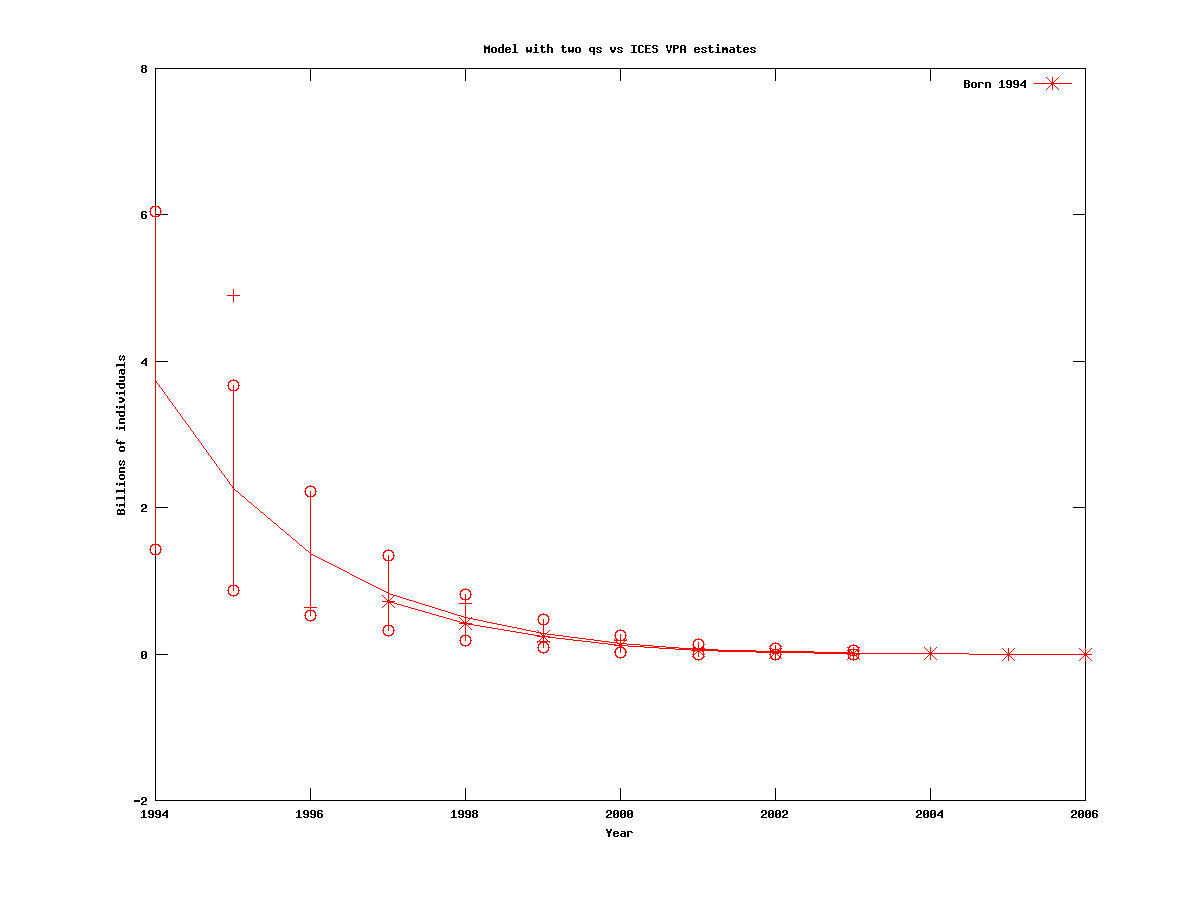
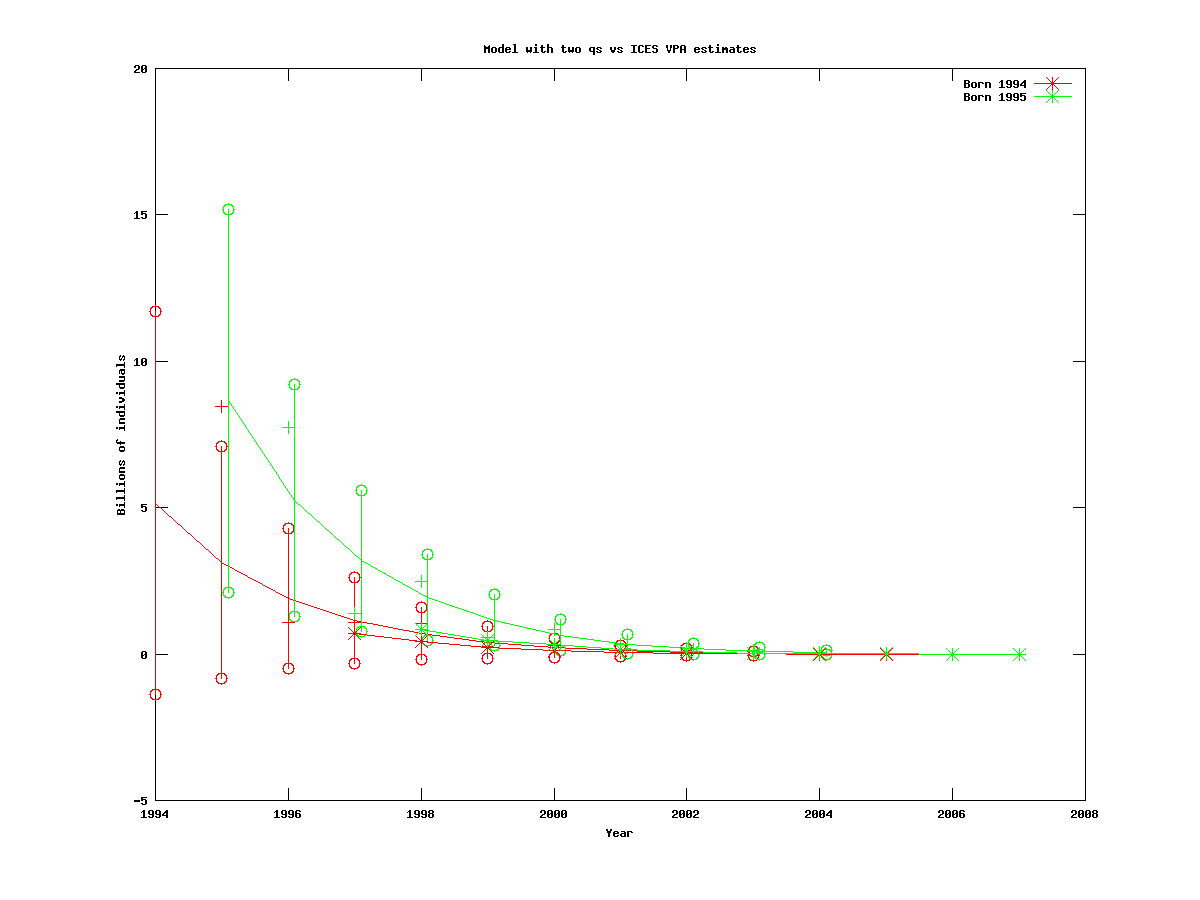
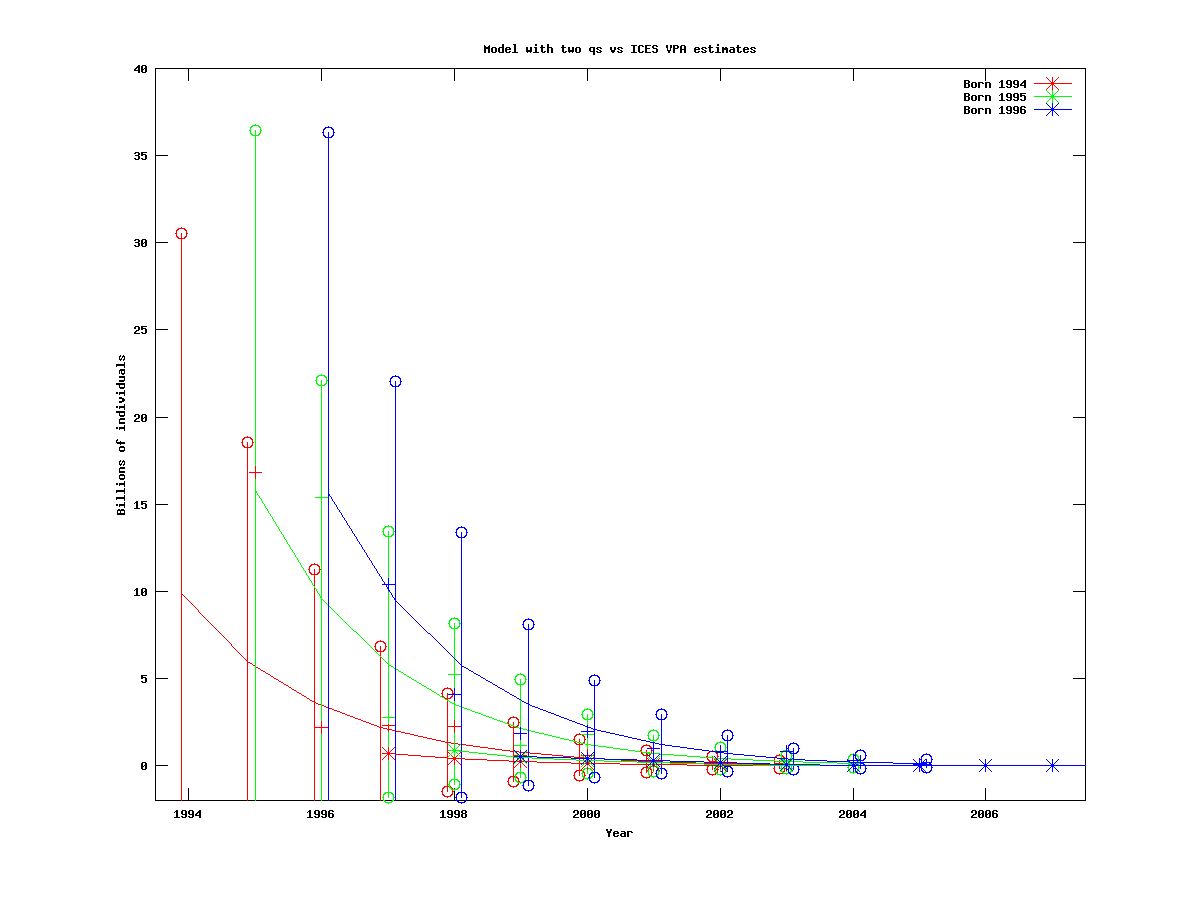
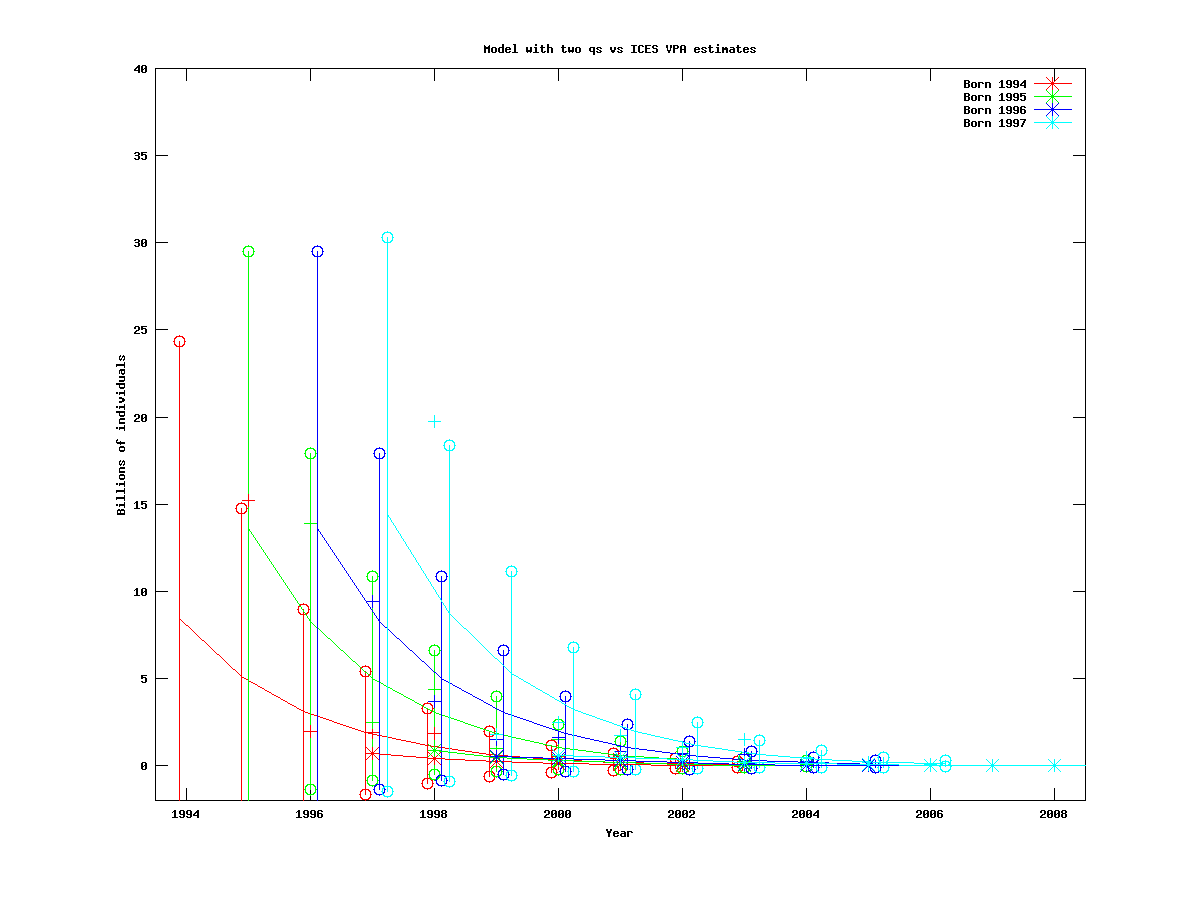
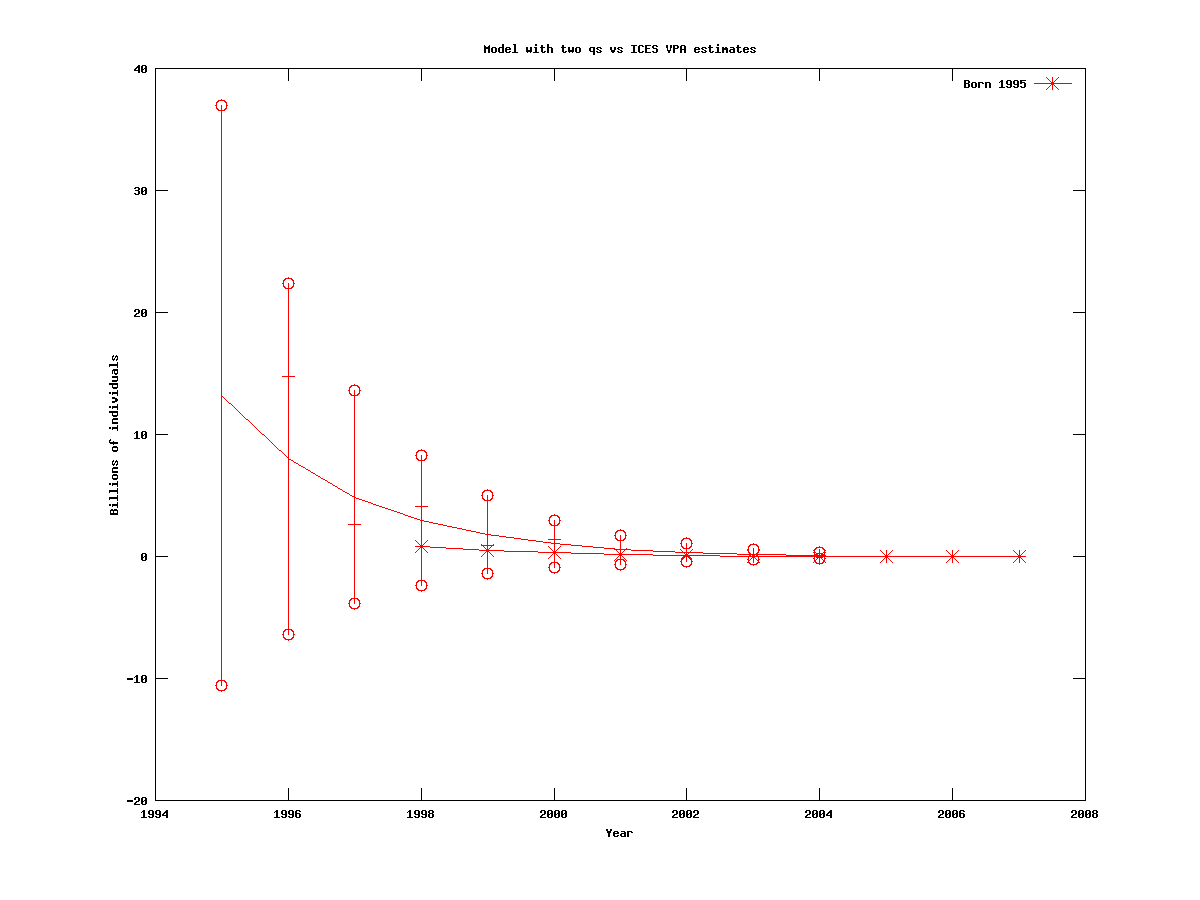
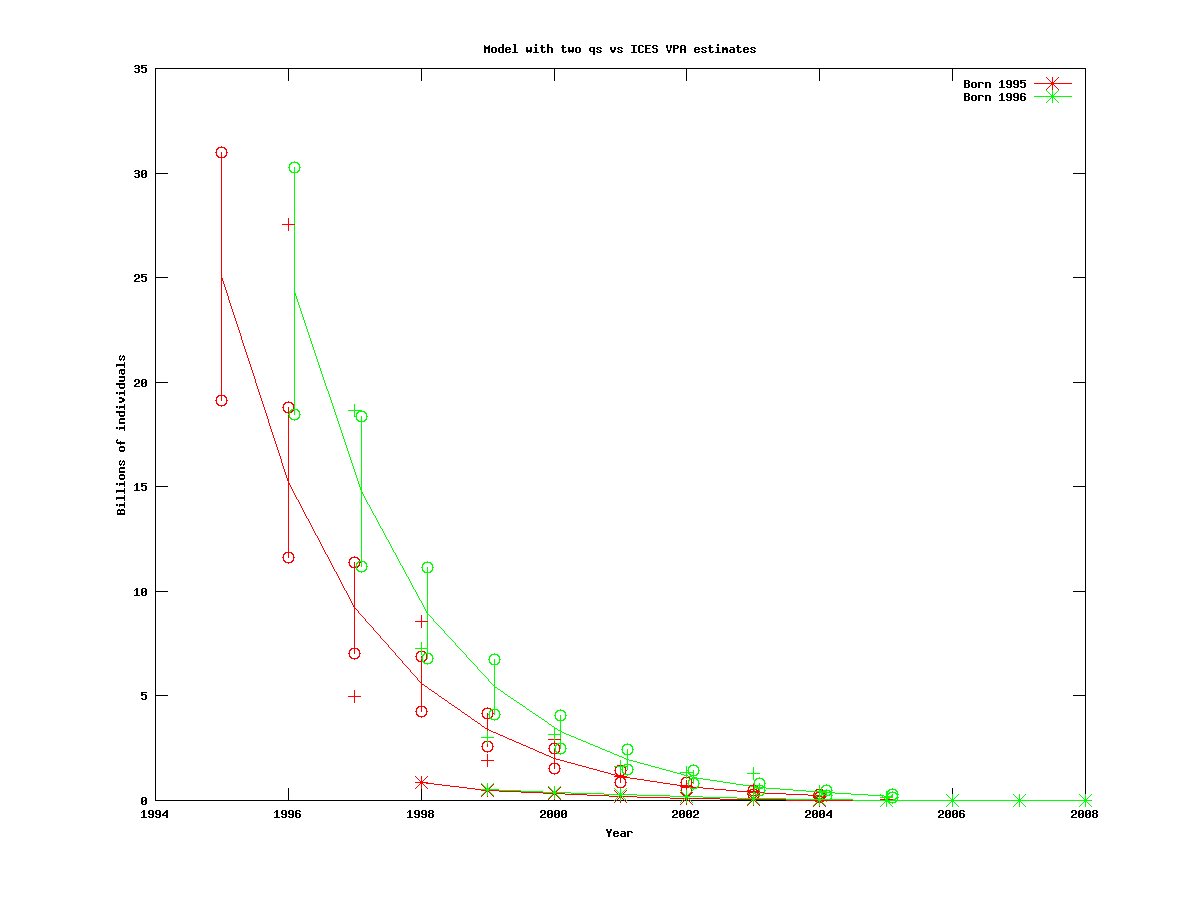
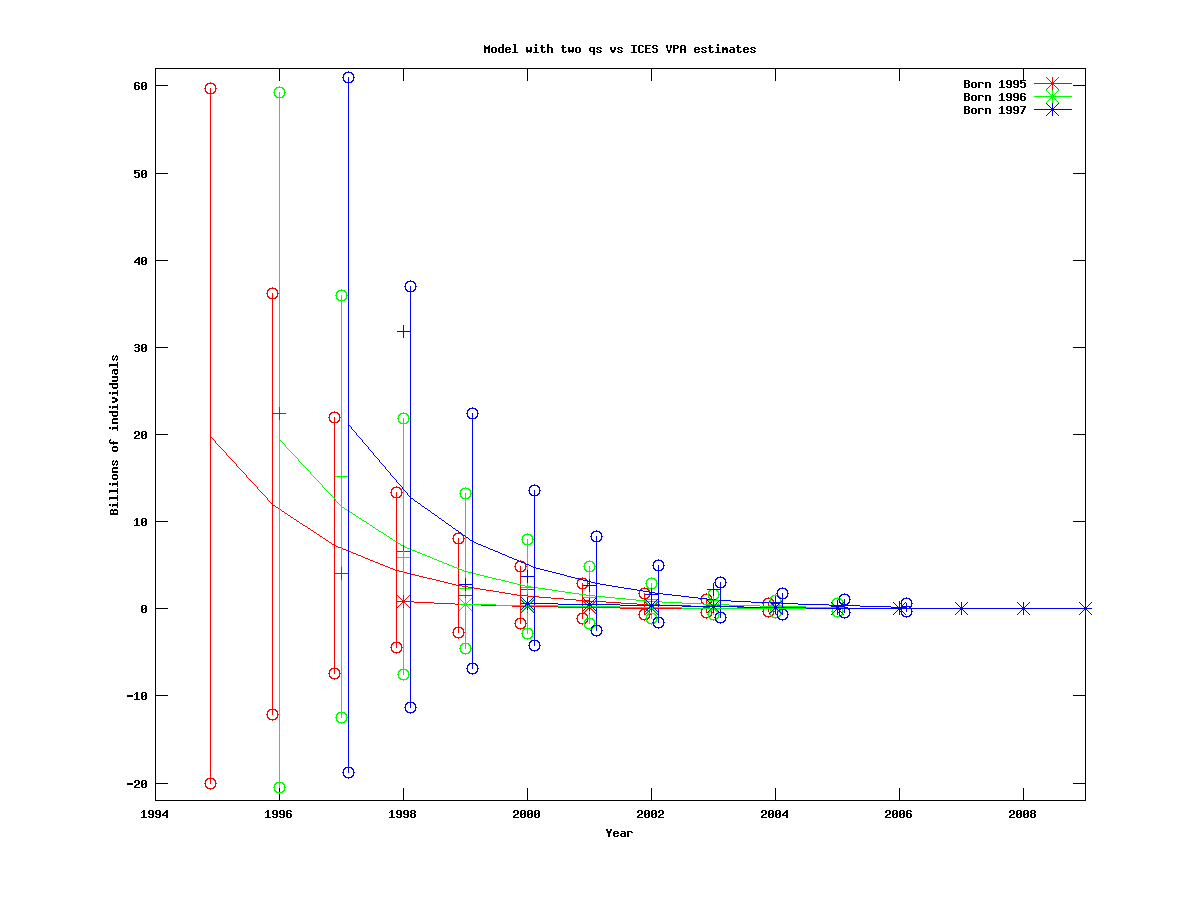
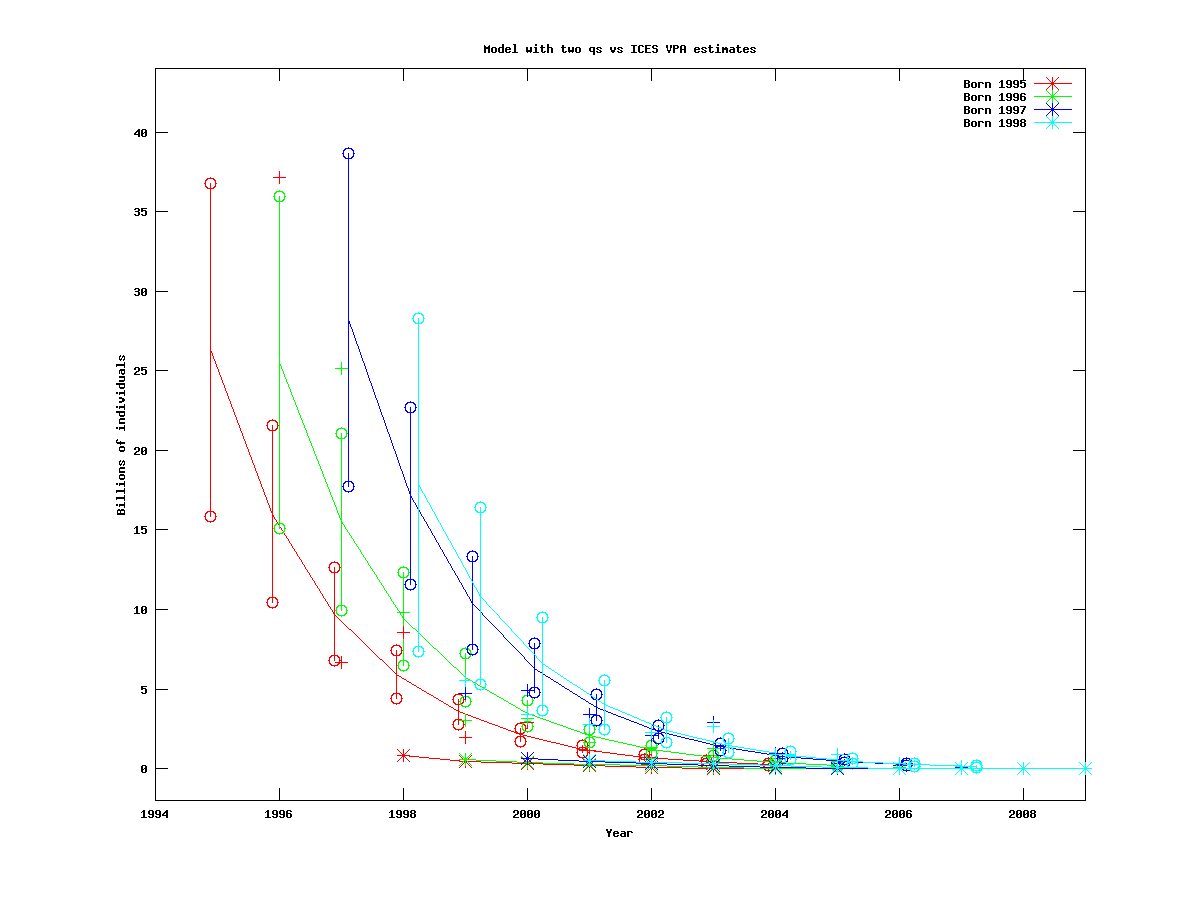
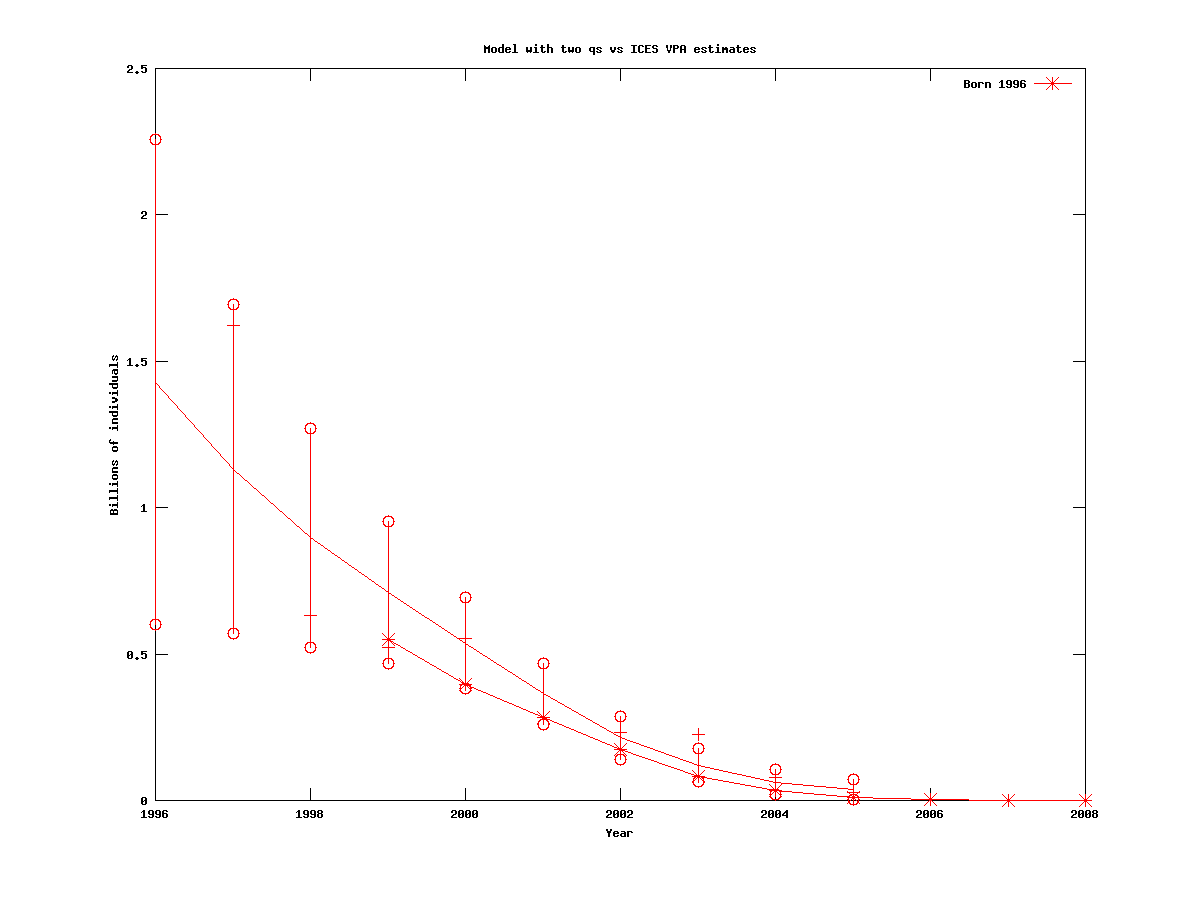
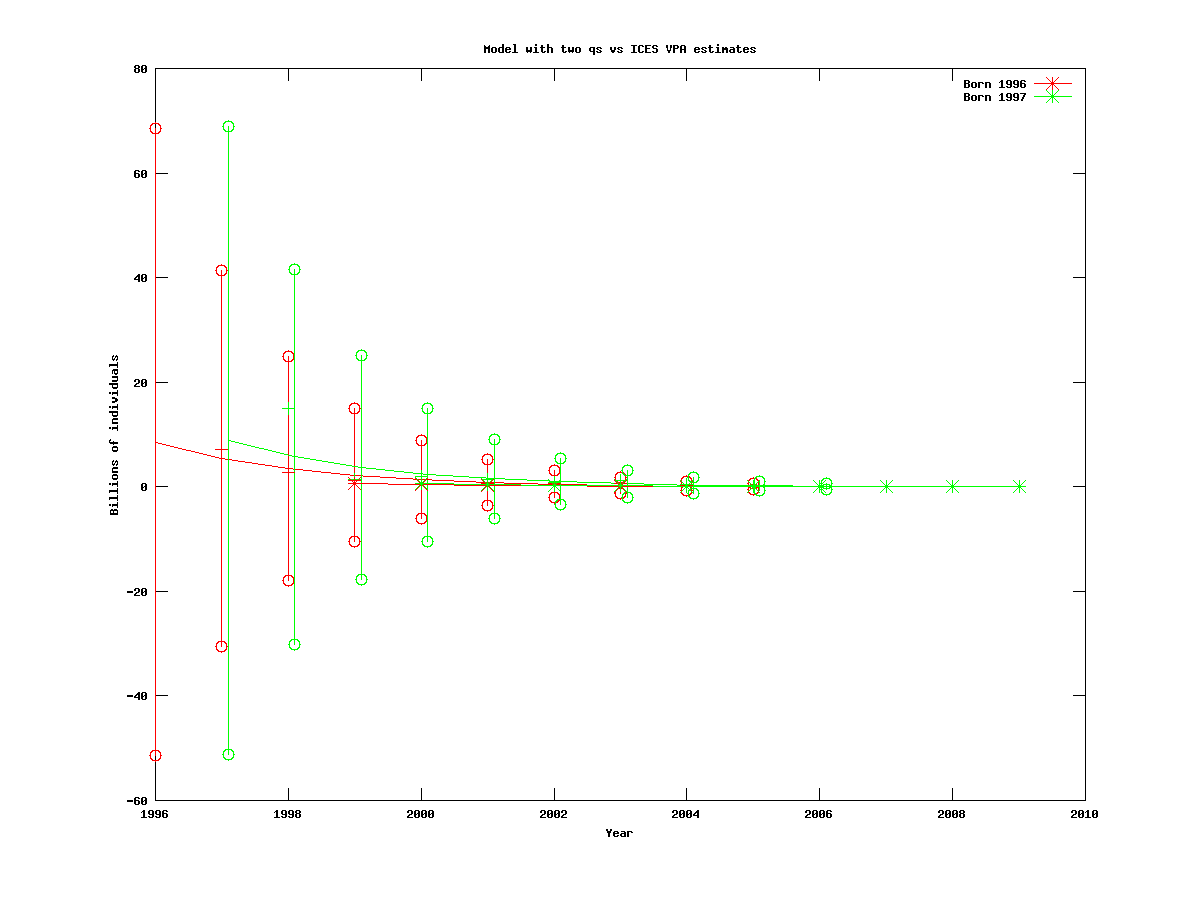
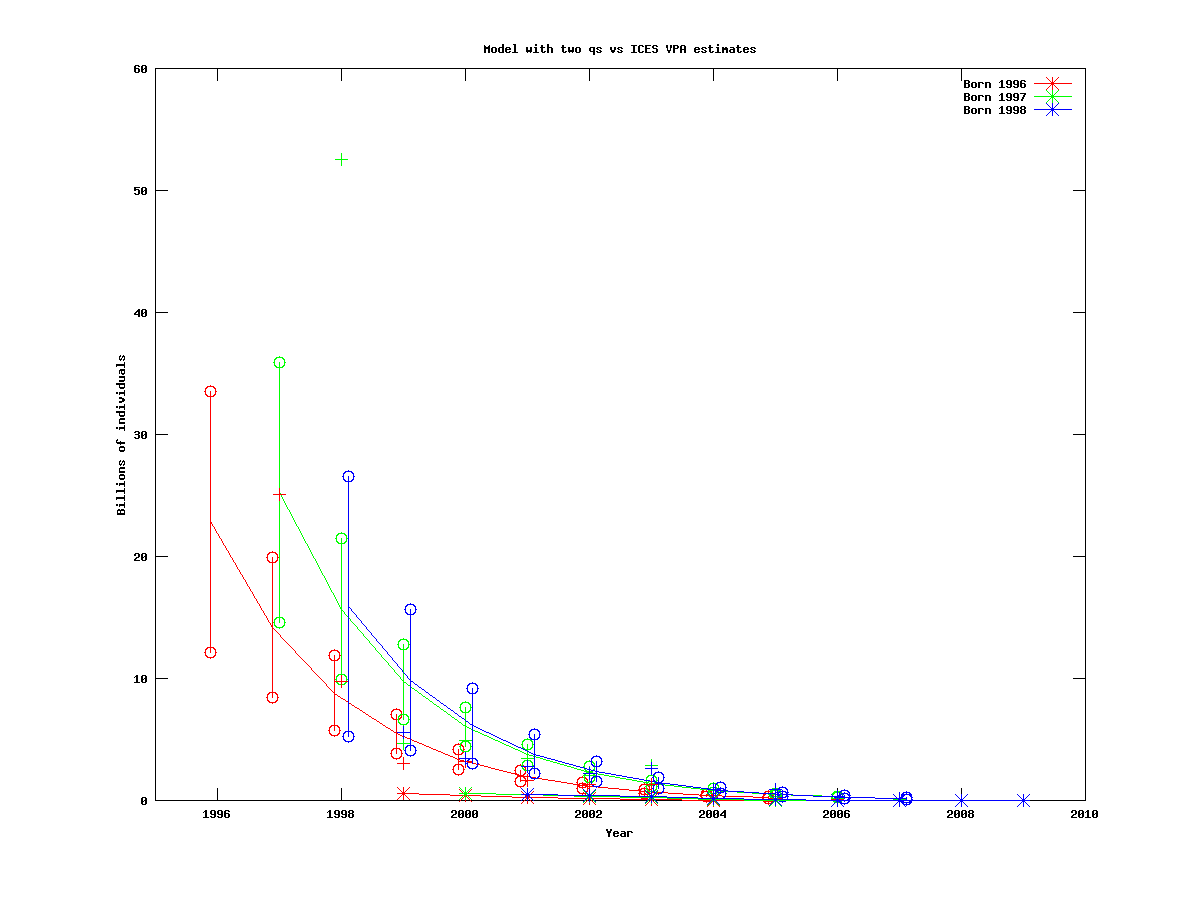
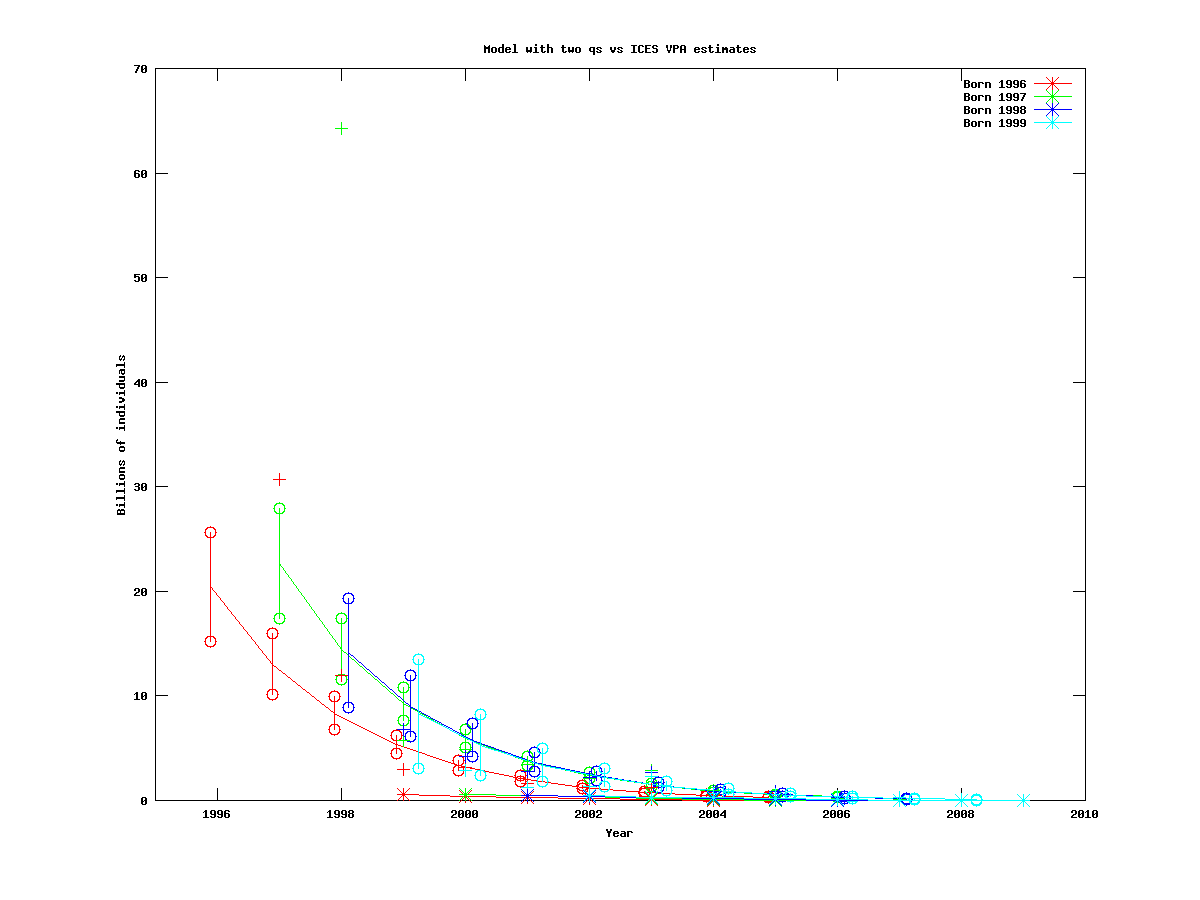
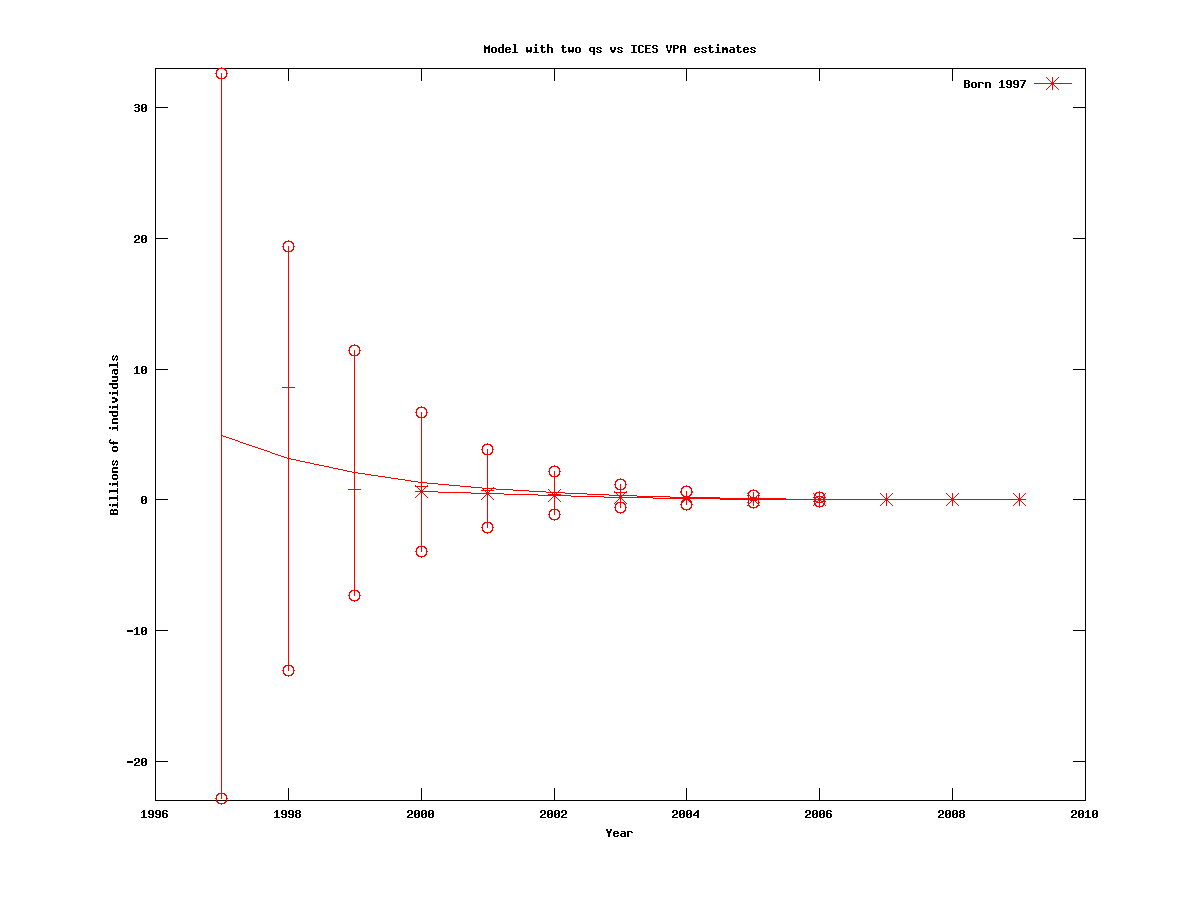
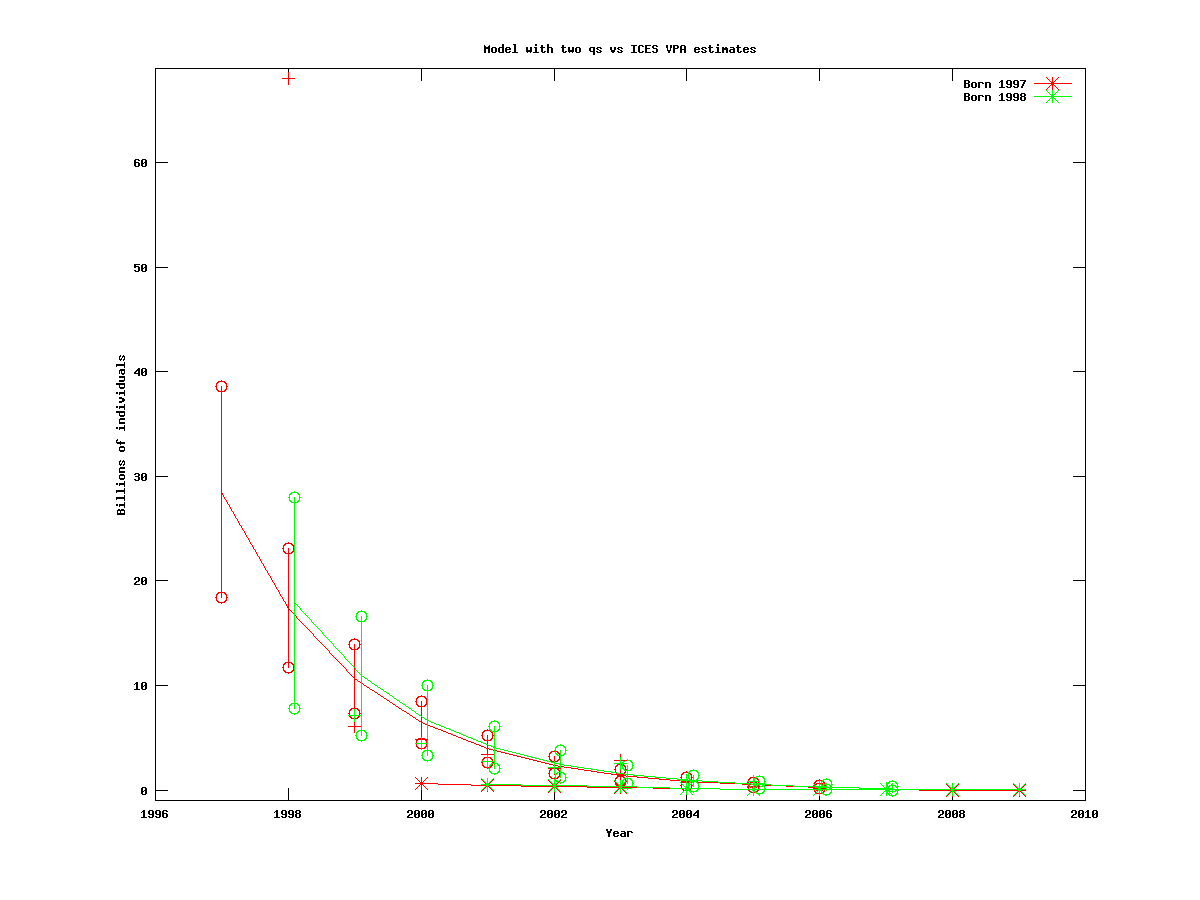
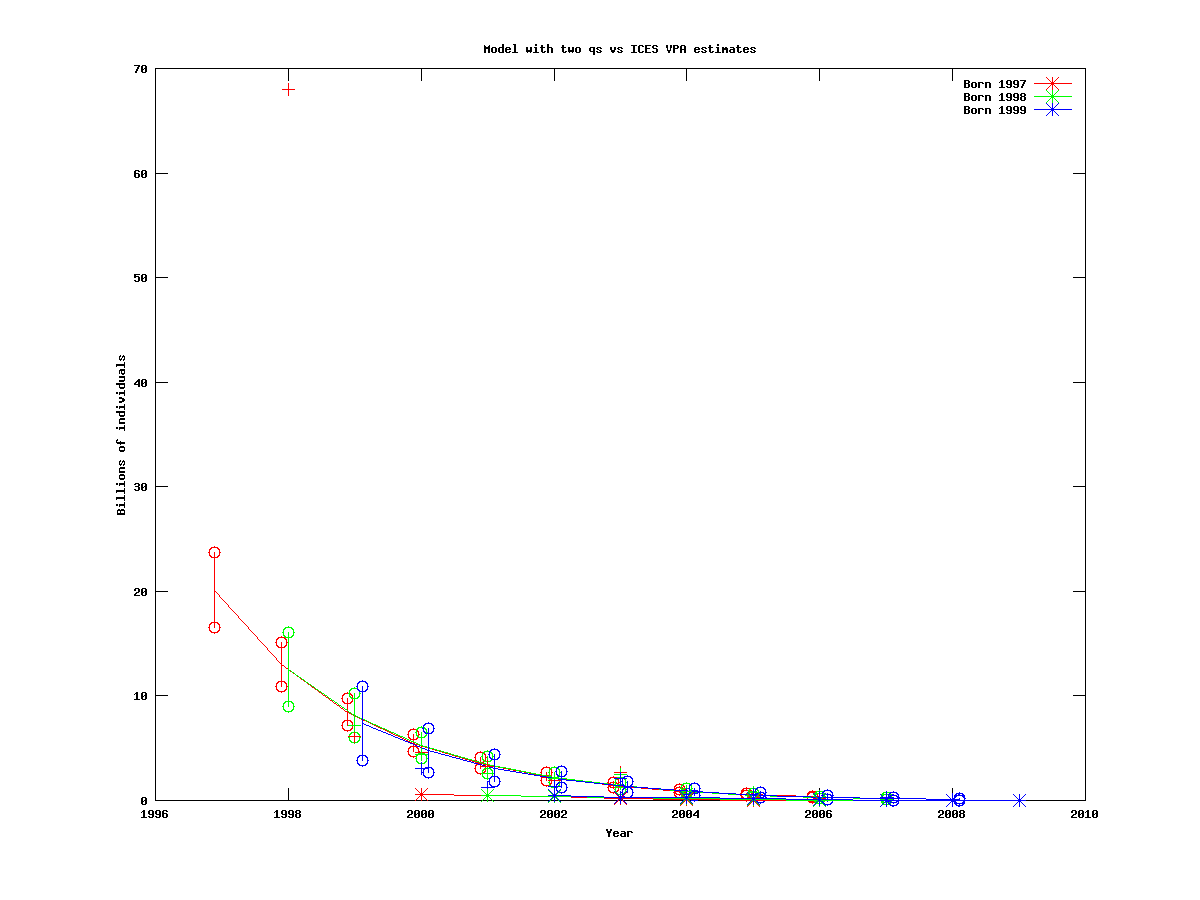
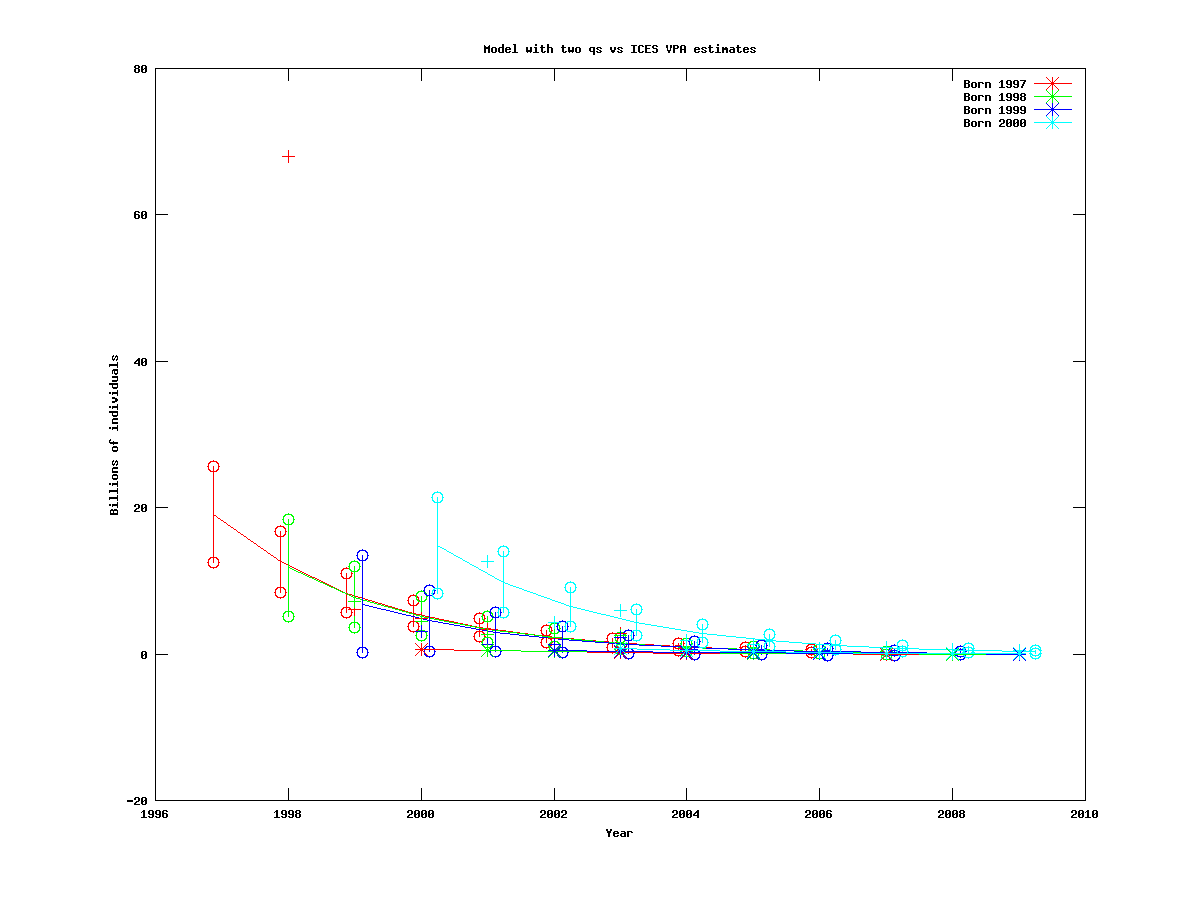
In this section we test the model with two catchabilities, to see how many cohorts should be included when we estimate the cohort sizes.
We test one through four cohorts, all starting with the cohort born 1994. The results are given below. The VPA estimates are solid lines with stars at each data point. The estimates of our model are solid lines with 95% confidence intevals, marked with circles at their endpoints.
 The VPA estimates are contained in the confidence intervals if we estimate one cohort, otherwise this is relatively rare.
 All our population level estimates are higher than the corresponding VPA estimates.
 For all but one of these runs, the mortality is very close to its upper bound of 0.5, which implies that only a fraction of exp(-0.5) = 0.6 of the individuals that escape catch survive to the next year.
 As the number of cohorts increases, the catchabilities frequently become very low, resulting in enourmous N0 estimates and standard deviations.


 Adding a single cohort may result in a dramatic change of the estimates! For instance, compare the single-cohort curves of the cohorts born in 1995 and 1996 (N01995 = 13.2, N01996 = 1.4), with the corresponding estimate of both these cohorts simultaneously (N01995 = 25.0, N01996 = 24.3).


