Table of Contents
Testing of various catch standard deviations --- q, s, M locked
For the model with latent variables for the catch data, we conduct the following experiments, all of which are done with this data set. First, the model without latent variables is run. The values for the catchability, standard deviation of the survey indices and the mortality are used as constants in the model with latent variables, which is run for various levels on the standard deviation of the catch data. Since most of the variable values are locked, the confidence intervals produced by the model are very small.
We test the following standard deviations on the catch: 0.05, 0.1, 0.15, 0.2 and 0.25.
For each run we report the misfit, which we define to be
| misfit = sum_{All observations} 0.5 * ( log(I) - log(qN) )2 |
|---|
In other words, the smaller this number is, the better the survey indices match the estimated stock size. As one can see, this number decreases when the standard deviation of the catch increases, with sc = 0.05 as the only exception.


Exact catch
Non-RE misfit: 1.820
The estimates and trajectories are:
| Num. cohorts | Trajectories | Estimates |
|---|---|---|
| 4 | 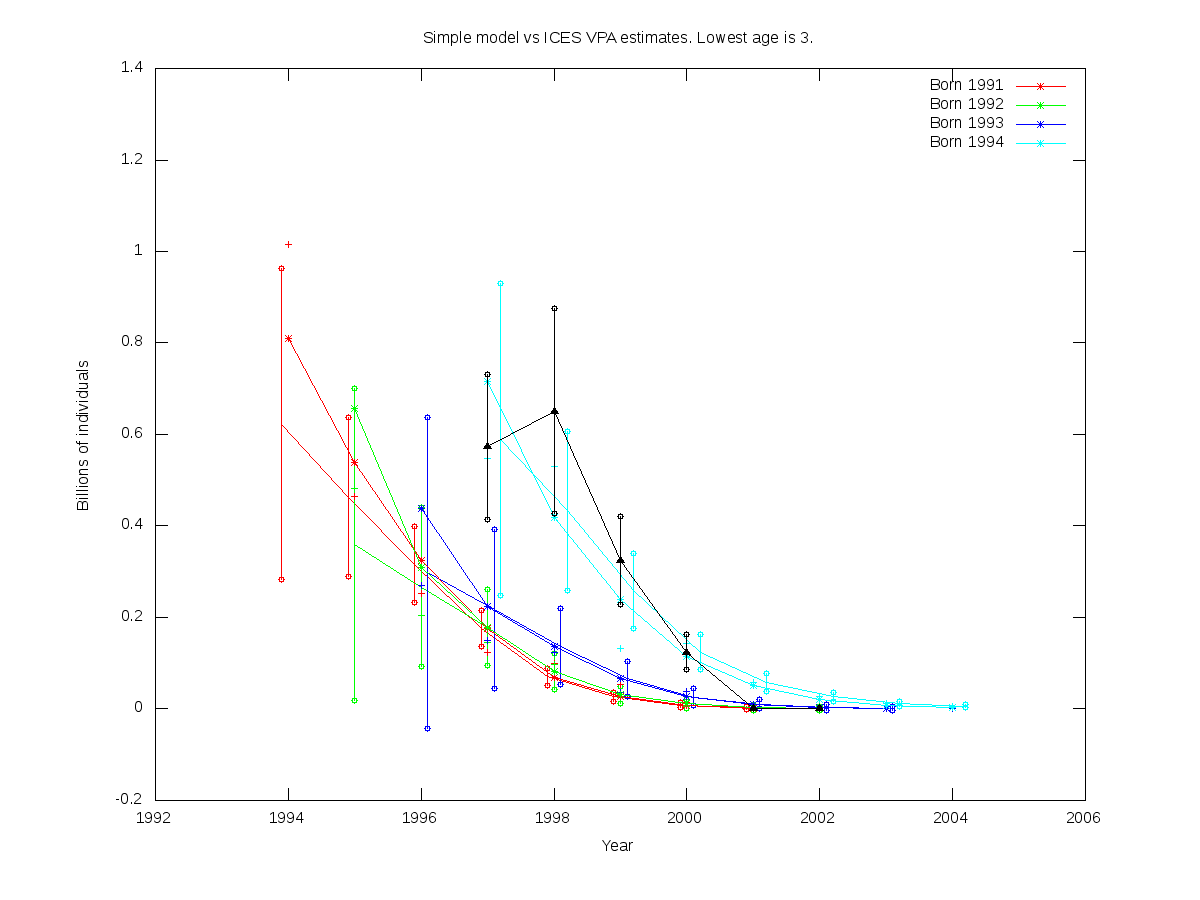 | Non-RE parfile:
|
sc = 0.05
RE misfit: 1.882
| Num. cohorts | Trajectories | Estimates |
|---|---|---|
| 4 | 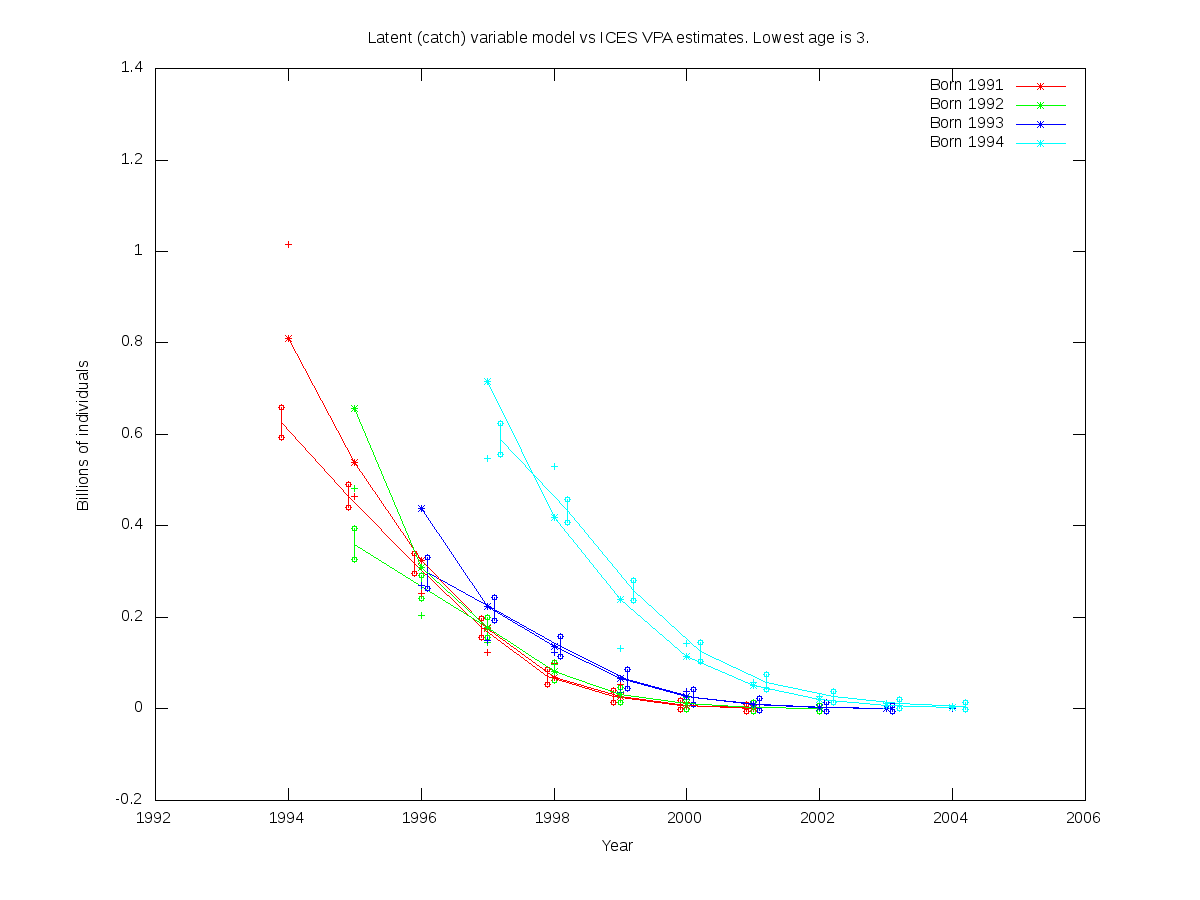 |
|
sc = 0.1
RE misfit: 1.765
| Num. cohorts | Trajectories | Estimates |
|---|---|---|
| 4 | 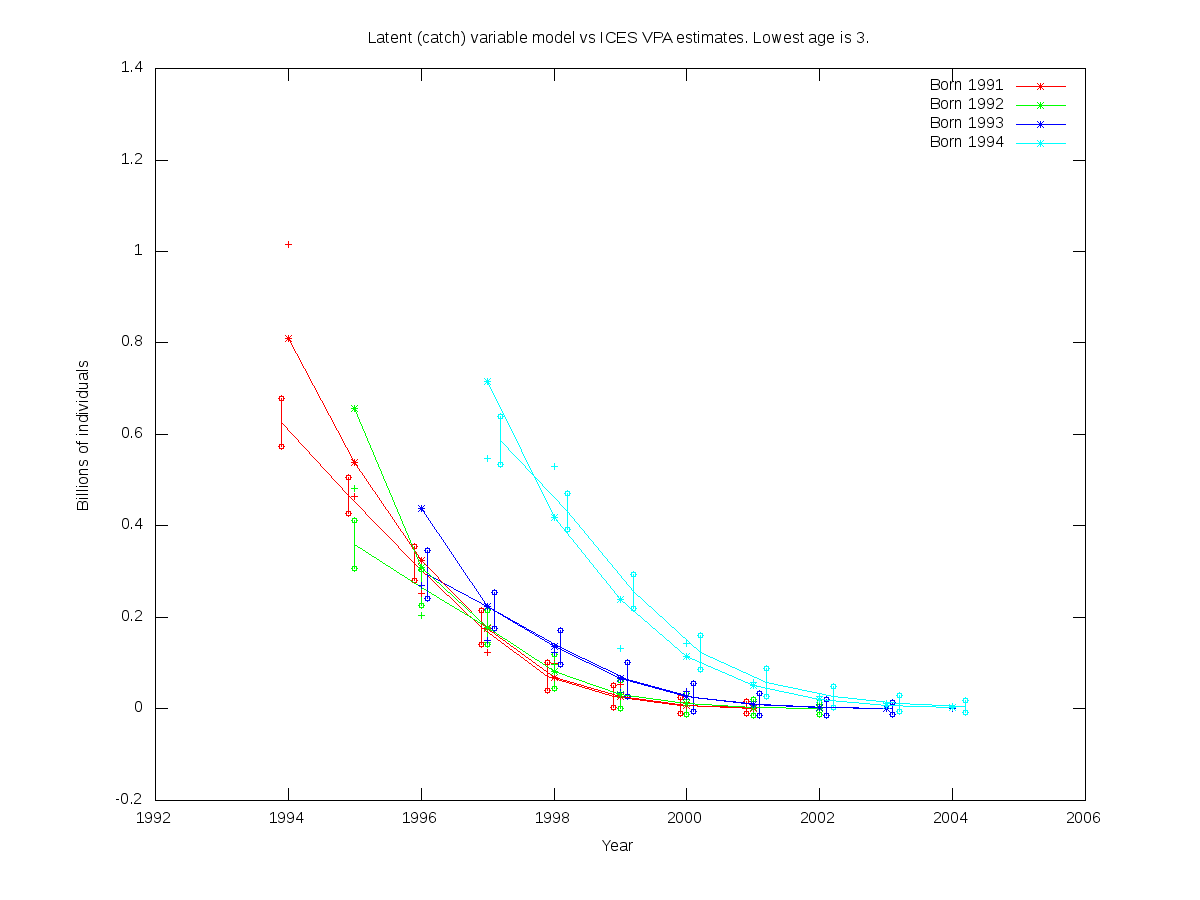 |
|
sc = 0.15
RE misfit: 1.661
| Num. cohorts | Trajectories | Estimates |
|---|---|---|
| 4 | 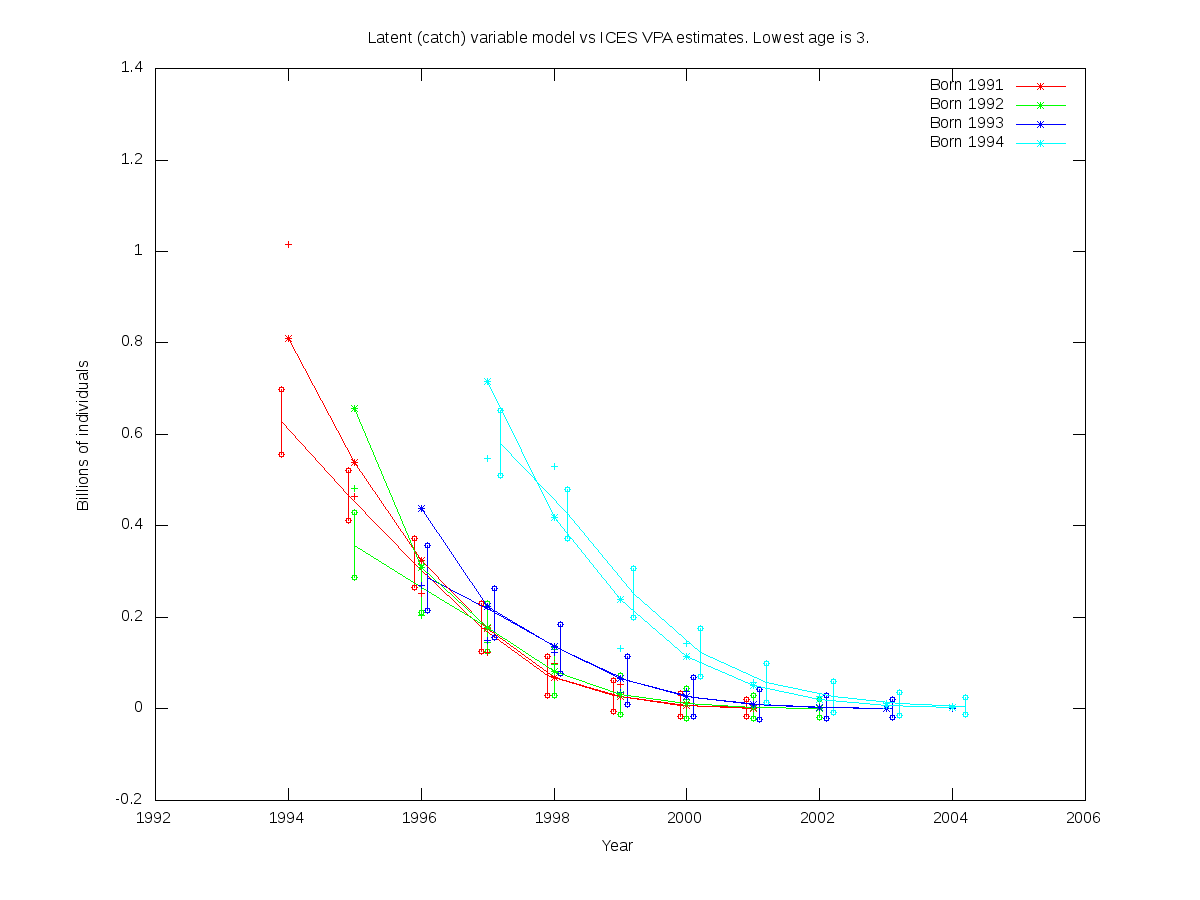 |
|
sc = 0.20
RE misfit: 1.543
| Num. cohorts | Trajectories | Estimates |
|---|---|---|
| 4 | 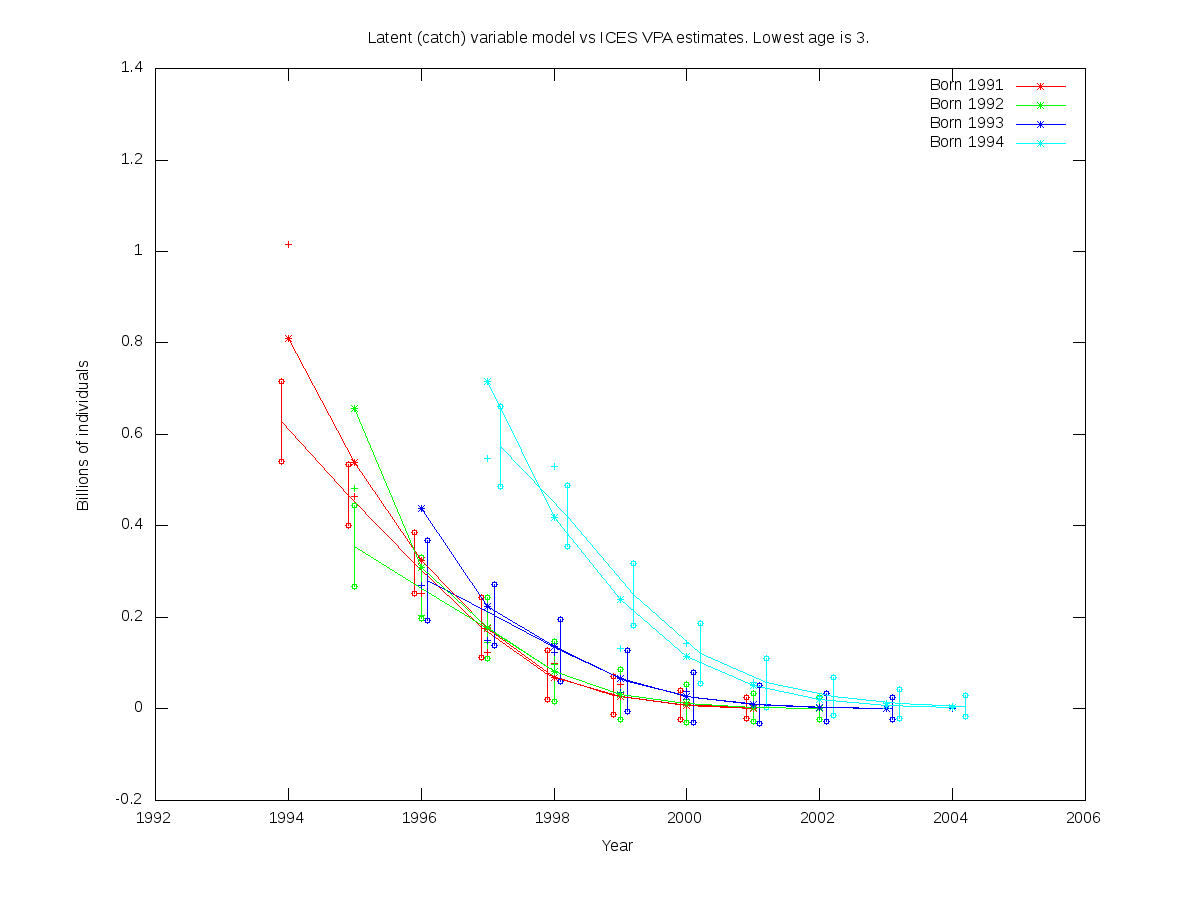 |
|
sc = 0.25
RE misfit: 1.420
| Num. cohorts | Trajectories | Estimates |
|---|---|---|
| 4 | 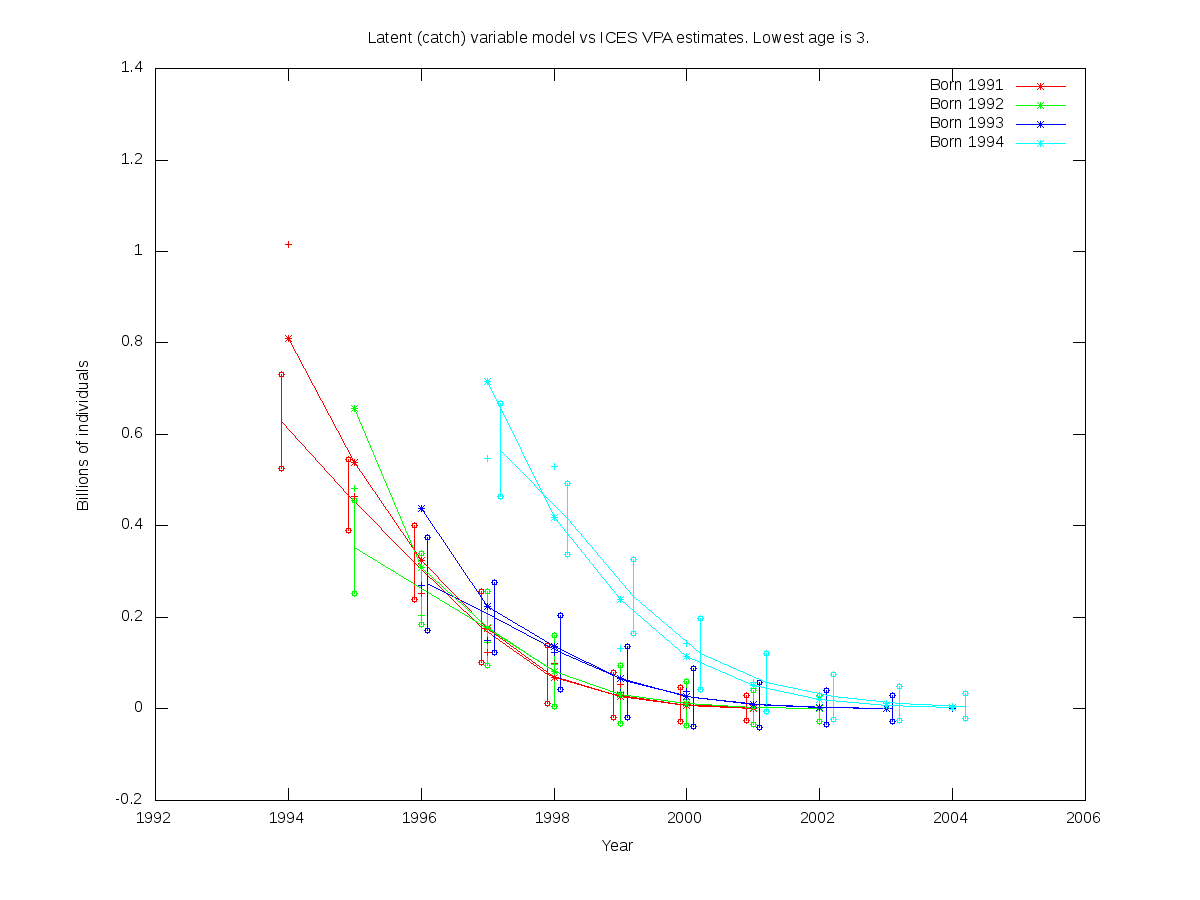 |
|