Testing different levels of sigma for catch --- no variables locked
Summary
As the catch sigma, sc, grows, the following trend is fairly evident:
M grows, ultimately reaching its upper bound of 0.5 for sc = 0.2.
q becomes smaller
N0 becomes larger
The discrepancy between these estimates and the VPA estimates becomes larger
Experiments
No latent variables
 This experiment is included for convenience.
| Num. cohorts | Trajectories | Estimates |
| | 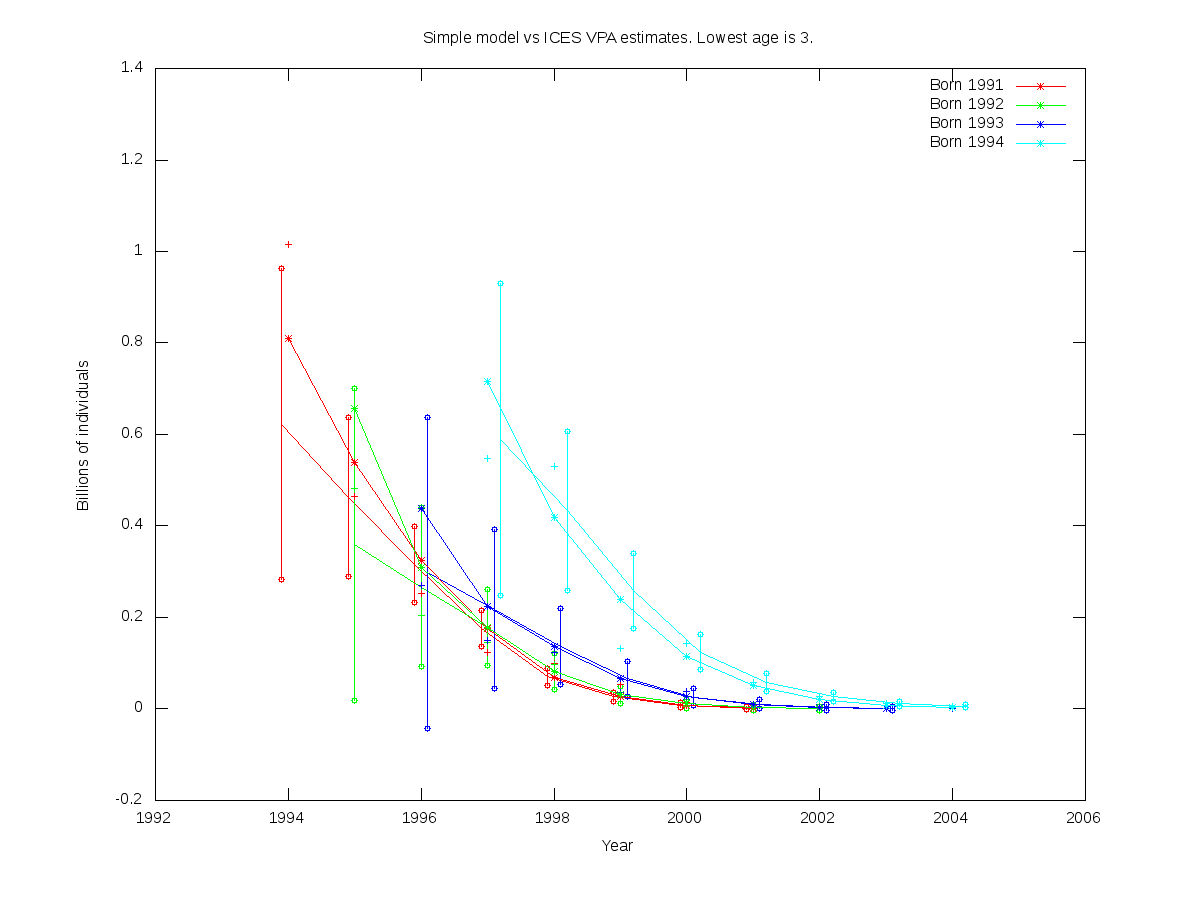 | Non-RE parfile:
- cod.par
../simple_model_sdreport/cod.par is the user-defined function defined from: ../simple_model_sdreport/cod.par

# Number of parameters = 7  Objective function value = -18.7801  Maximum gradient component = 0.000328611
# N0:
 0.622791 0.359443 0.298084 0.589102
# q:
 0.344332
# logs:
-1.08687795940
# M:
0.286208904677
|
sc = 0.05
| Num. cohorts | Trajectories | Estimates |
| 4 | 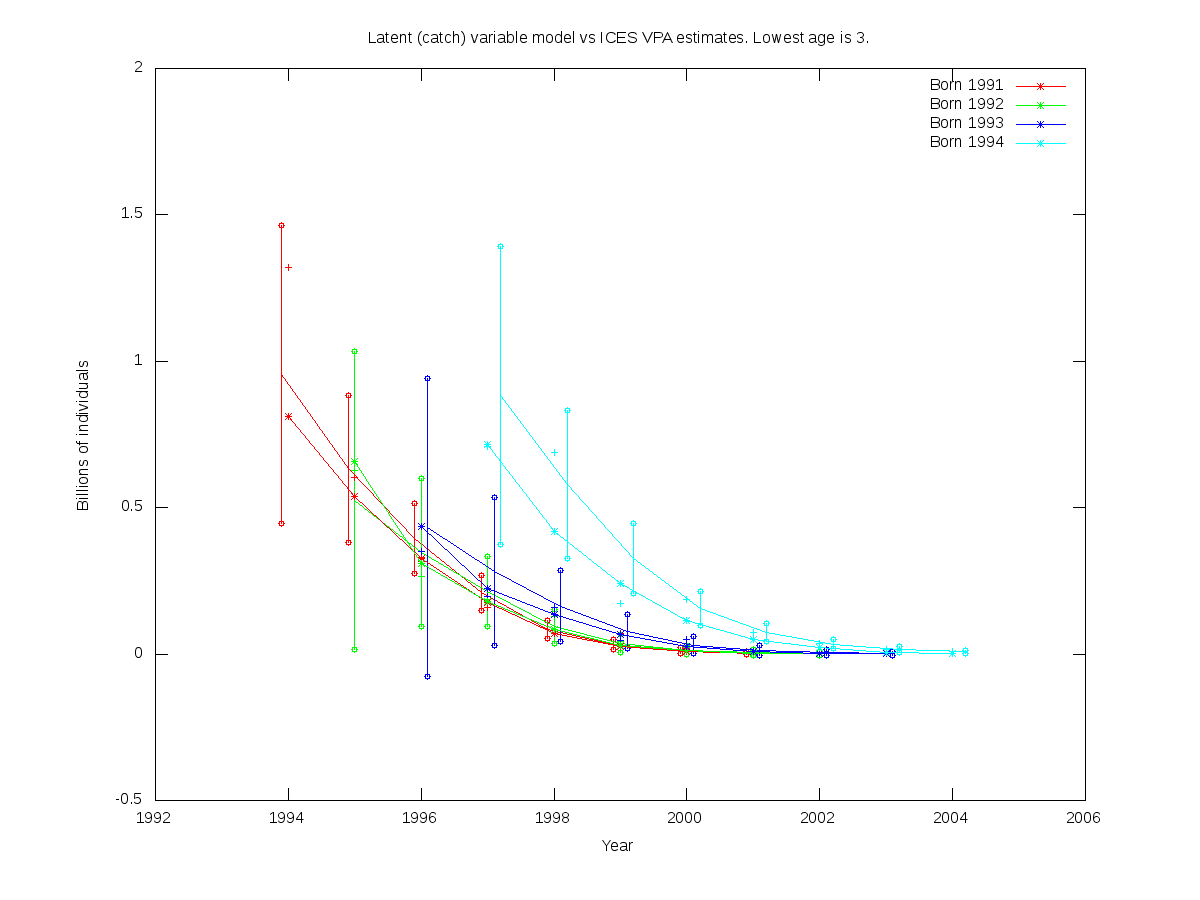 |
- cod.par
# Number of parameters = 7  Objective function value = -42.6068  Maximum gradient component = 2.91970e-05
# N0:
 0.954542 0.525020 0.430878 0.882205
# q:
 0.265073
# logs:
-1.03834928714
# M:
0.404604934881
# logscc:
-2.99570000000
# ce:
 0.00247779228022 0.0229479340199 0.0505688023129 0.0348894489419 0.0918032224103 0.212086776154 0.191245255713 0.00335207864357 0.0208592944745 0.0594545624313 0.101789222254 0.0853961577455 0.179938079275 0.00514895739156 0.00328054977142 0.00437998603931 0.00576553600065 -0.0769757385253 0.0294089236518 -0.0305535704978 -0.0140065689668 4.29956956392e-05 0.0109425978175 -0.0559566234943 -0.0224908139433 -0.0140483408608 -0.00256440139985 -0.00370045247271
|
sc = 0.10
| Num. cohorts | Trajectories | Estimates |
| 4 | 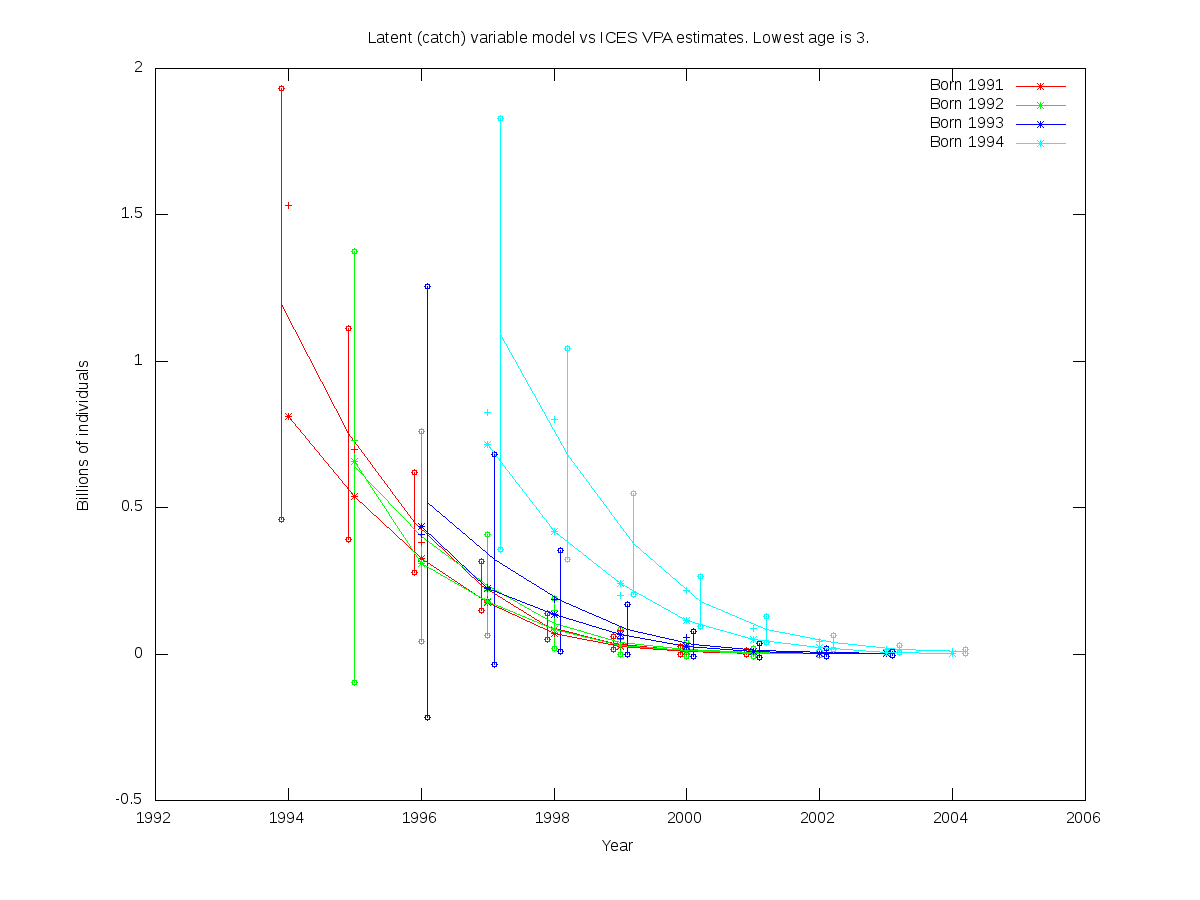 |
- cod.par
# Number of parameters = 7  Objective function value = -41.3791  Maximum gradient component = 3.12158e-05
# N0:
 1.19545 0.639165 0.518724 1.09328
# q:
 0.228269
# logs:
-1.01217107551
# M:
0.458196640288
# logscc:
-2.30260000000
# ce:
 0.00299214635483 0.0278701196646 0.0618741327868 0.0383751969798 0.151822644707 0.365608394606 0.315531984532 0.00354899496011 0.0189950405372 0.0553077224029 0.153107532812 0.151731450319 0.326735539914 0.0241126794416 0.00287476031833 -0.00857989801320 -0.0134792904902 -0.137915370233 0.0555630741024 -0.0346120370533 -0.0130079769725 8.47659405510e-06 0.0155516659659 -0.0919629932316 -0.0385161866978 -0.0235292761542 -0.00422480068144 -0.00717389958011
|
sc = 0.15
| Num. cohorts | Trajectories | Estimates |
| 4 | 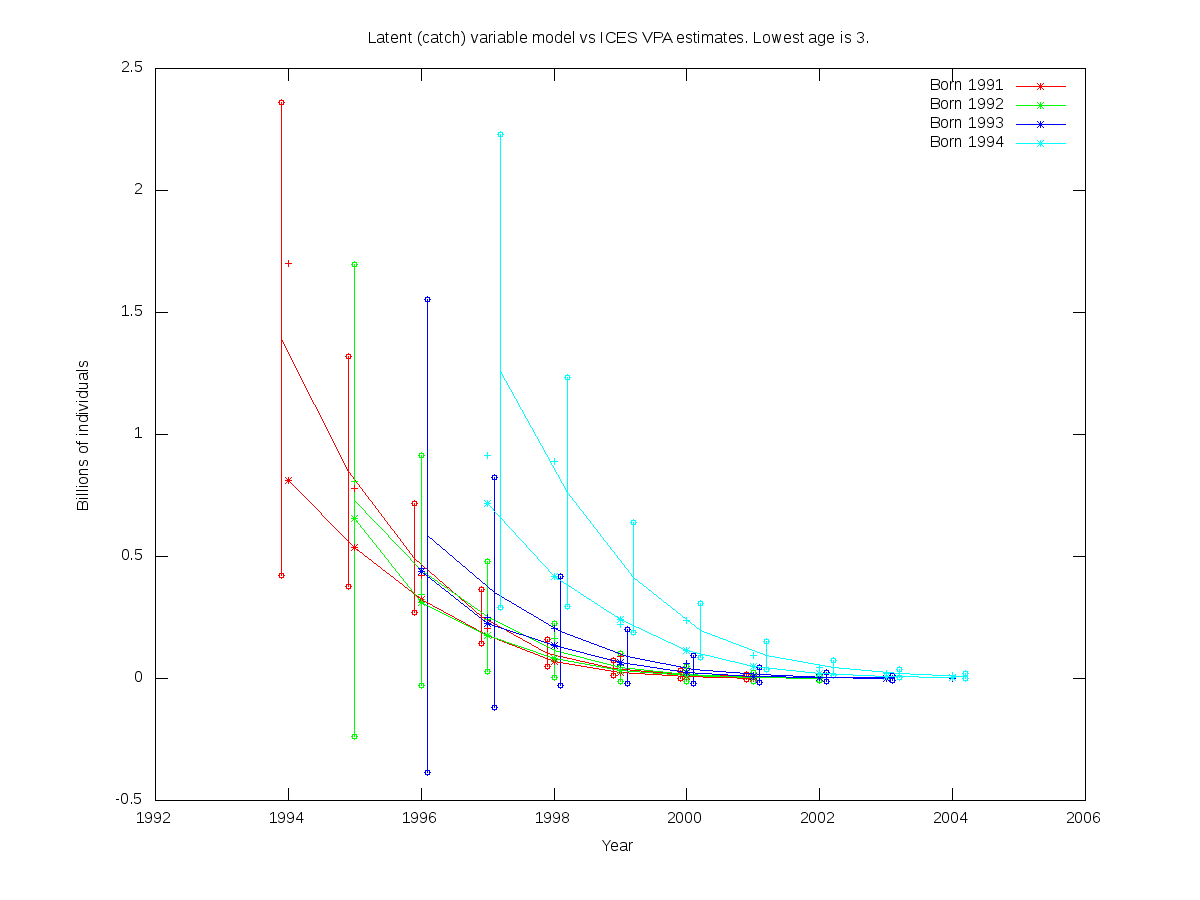 |
- cod.par
# Number of parameters = 7  Objective function value = -40.6063  Maximum gradient component = 1.19145e-05
# N0:
 1.39098 0.729901 0.584592 1.26028
# q:
 0.205649
# logs:
-0.998781332763
# M:
0.490865532859
# logscc:
-1.89710000000
# ce:
 0.00317048912124 0.0291209453032 0.0634454016256 0.0313686081751 0.195132842454 0.493828424086 0.418259928564 0.00349535088274 0.0153966976922 0.0458988145034 0.194963732184 0.210402923647 0.459597257978 0.0424825792486 0.00219905797630 -0.0212146471716 -0.0299847853587 -0.182269221474 0.0844923100721 -0.0290441396331 -0.00763730108872 -0.000151418302052 0.0175157014252 -0.121951064410 -0.0528439366573 -0.0320061721550 -0.00613491712179 -0.0104048634647
|
sc = 0.20
 M reaches its upper bound, so the confidence intervals are not meaningful in this case.
| Num. cohorts | Trajectories | Estimates |
| 4 | 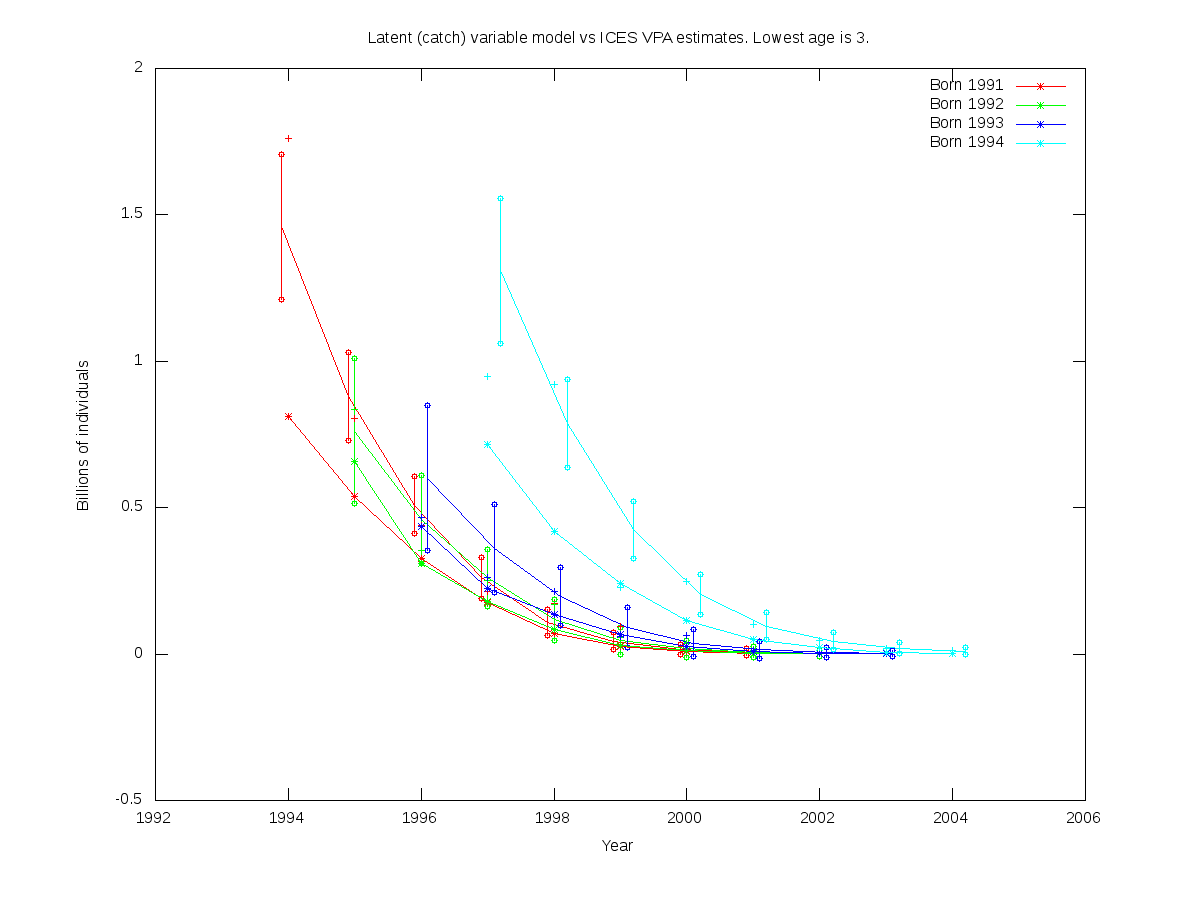 |
- cod.par
# Number of parameters = 7  Objective function value = -40.0734  Maximum gradient component = 8.87886e-05
# N0:
 1.45886 0.761022 0.600593 1.30925
# q:
 0.198675
# logs:
-1.00077721043
# M:
0.500000000000
# logscc:
-1.60940000000
# ce:
 0.00363596210240 0.0328946839321 0.0690333423964 0.0219343626062 0.238833510443 0.647454025196 0.555654527656 0.00354347952971 0.0110982161633 0.0278238159678 0.226249885147 0.258422309992 0.605012616754 0.0523466267305 0.00165991134421 -0.0343769623289 -0.0465724924036 -0.231641419023 0.115770675459 -0.0281268857527 -0.00436850366929 6.94740923935e-05 0.0264814039215 -0.146575395945 -0.0591572604359 -0.0334358023913 -0.00183361619039 -0.0119811817291
|


