This is an old revision of the document!
Testing which variables in {q, s, M} to hold constant (if any)
In this section we test which variables it is beneficial to lock to some value, given a (fixed) standard deviation on the catch. For these experiments we use a fixed standard deviation of 0.15 for the catch. For all the experiments this data set is used.
The variables in question are the catchability, standard deviation of the survey indices, and the mortality. For comparison, we first run the model without latent variables, and then with all three variable locked. Both of these experiments are conducted in the section on choosing the standard deviation as well.
 Note AD Model builder refers to latent variables as random effects, abbreviated as RE. This abbreviation appears below when talking about misfit to the survey data.
Summary
| Experiment | Comments |
| Exact catch (no latent variables) | This can be considered the base case. The parameter estimates are seemingly reasonable, but the confidence intervals are relatively large. The parameter estimates and standard deviations are:
- cod.std
 index   name    value      std dev
     1   N0      6.2279e-01 1.9740e-01
     2   N0      3.5944e-01 1.0202e-01
     3   N0      2.9808e-01 8.2594e-02
     4   N0      5.8910e-01 1.7350e-01
     5   q       3.4433e-01 6.3806e-02
     6   logs   -1.0869e+00 1.2500e-01
     7   M       2.8621e-01 9.6269e-02
The N0 variables are (despite their name) billions of individuals in age group three, with the first cohort born in 1991, the next in 1992, and so on.
|
| All variables locked | The only free variables are the stock sizes and the latent variables. The stock size estimates are essentially equal to the base case. Since so many variables are locked, the confidence intervals are very small. The misfit is better than for the base case. |
| No variables locked | The stock estimates are about double what they are in the base case. To compensate, the mortality almost reaches its upper bound, and the confidence intervals are larger than for the base case. The misfit is worse than the base case. |
| q locked | The stock estimates are slightly larger than for the base case. The mortality is also slightly larger. The confidence intervals are very small, and the misfit is better than for the base case. |
| s locked | |
| M locked | |
| q, s, locked | |
| q, M, locked | |
| s, M, locked | |
Experiments from section on misfit testing
Exact catch
Non-RE misfit: 1.820
The estimates and trajectories are:
| Num. cohorts | Trajectories | Estimates |
| 4 | 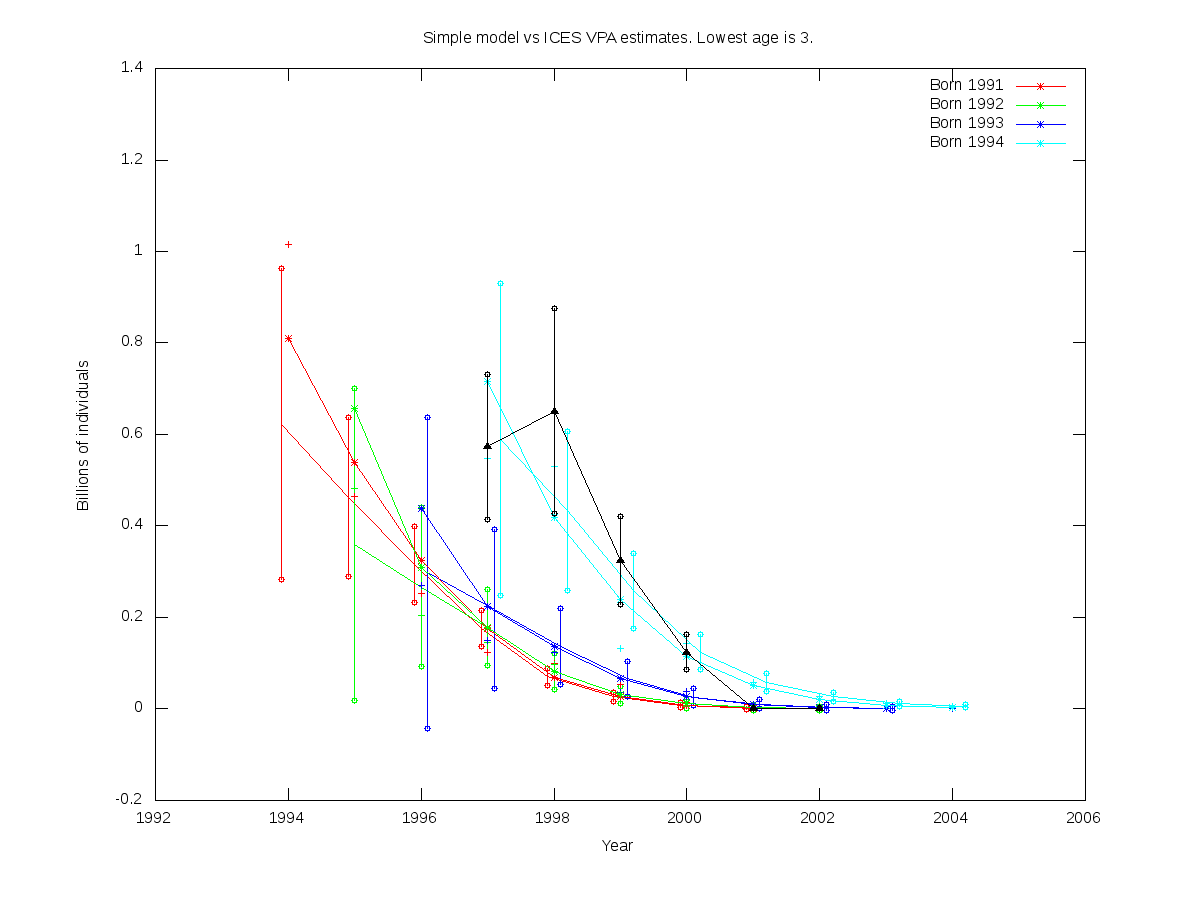 | Non-RE parfile:
- cod.par
../simple_model_sdreport/cod.par is the user-defined function defined from: ../simple_model_sdreport/cod.par

# Number of parameters = 7  Objective function value = -18.7801  Maximum gradient component = 0.000328611
# N0:
 0.622791 0.359443 0.298084 0.589102
# q:
 0.344332
# logs:
-1.08687795940
# M:
0.286208904677
|
All variables locked
RE misfit: 1.661
| Num. cohorts | Trajectories | Estimates |
| 4 |  |
- cod.par
# Number of parameters = 4  Objective function value = -37.8395  Maximum gradient component = 8.42471e-05
# N0:
 0.627756 0.358000 0.287267 0.580884
# q:
 0.344330
# logs:
-1.08690000000
# M:
0.286210000000
# logscc:
-1.89710000000
# ce:
 0.00874495514757 0.0760265461654 0.115882157306 -0.0707826286747 0.151430209660 0.611123044389 0.717677634190 0.00681978747091 0.0169088880577 -0.0517818229251 0.0740424294426 0.0625218779776 0.463932951854 -0.114733356896 0.00297546617756 -0.0567185172784 -0.129556977585 -0.449898032102 -0.00965238424925 -0.231960325692 -0.114328666724 0.00485844416478 0.105422304293 -0.163748016705 -0.0380416440742 -0.0255873228041 0.00740885850240 -0.00459962718646
|
No Variables locked
RE misfit: 1.987
| Num. cohorts | Trajectories | Estimates |
| 4 | 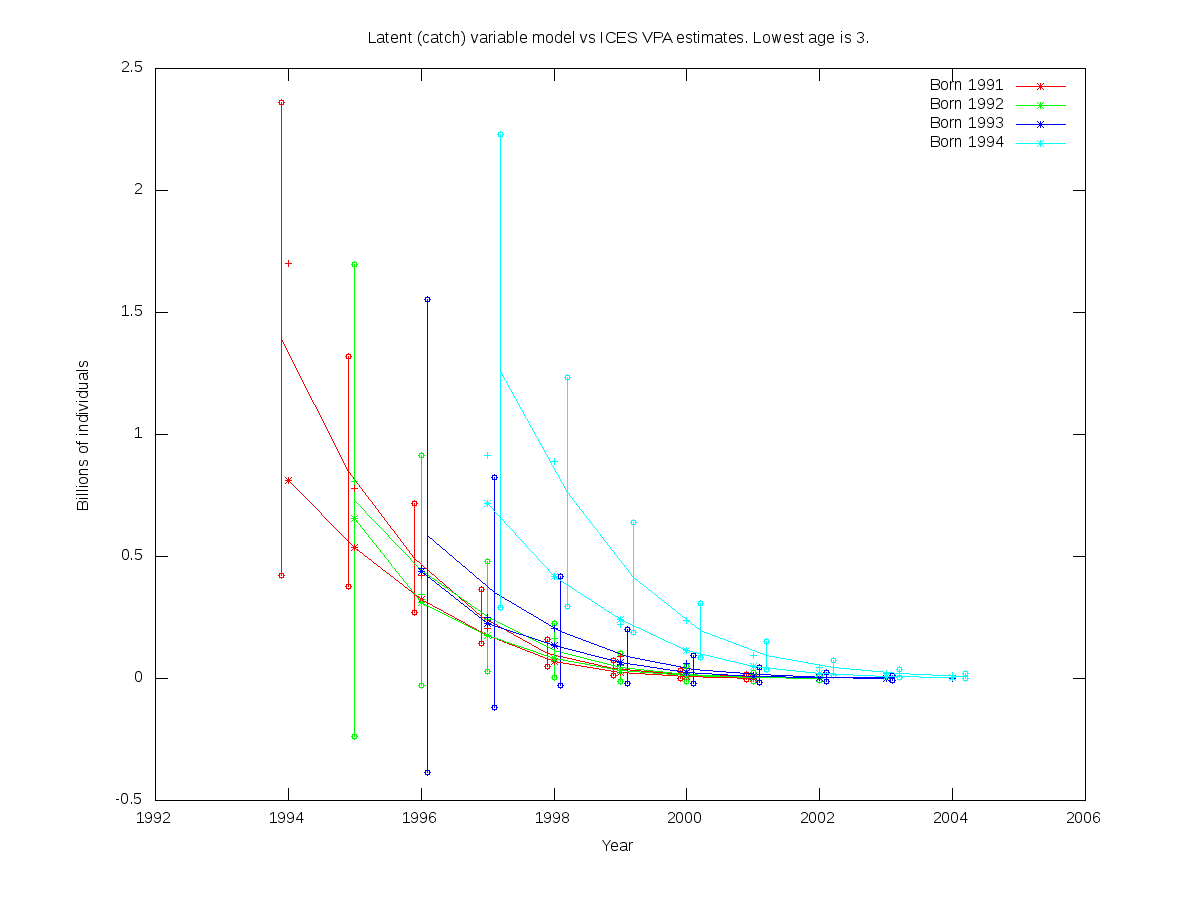 |
- cod.par
# Number of parameters = 7  Objective function value = -40.6063  Maximum gradient component = 1.19145e-05
# N0:
 1.39098 0.729901 0.584592 1.26028
# q:
 0.205649
# logs:
-0.998781332763
# M:
0.490865532859
# logscc:
-1.89710000000
# ce:
 0.00317048912124 0.0291209453032 0.0634454016256 0.0313686081751 0.195132842454 0.493828424086 0.418259928564 0.00349535088274 0.0153966976922 0.0458988145034 0.194963732184 0.210402923647 0.459597257978 0.0424825792486 0.00219905797630 -0.0212146471716 -0.0299847853587 -0.182269221474 0.0844923100721 -0.0290441396331 -0.00763730108872 -0.000151418302052 0.0175157014252 -0.121951064410 -0.0528439366573 -0.0320061721550 -0.00613491712179 -0.0104048634647
|
One variable locked
q locked
RE misfit: 1.672
| Num. cohorts | Trajectories | Estimates |
| 4 |  |
- cod.par
# Number of parameters = 6  Objective function value = -38.1222  Maximum gradient component = 1.58997e-05
# N0:
 0.688093 0.388890 0.312130 0.632147
# q:
 0.344330
# logs:
-1.05567121517
# M:
0.317039777195
# logscc:
-1.89710000000
# ce:
 0.00686597099921 0.0547785923955 0.0622178973542 -0.131530656196 0.0891397901882 0.525908598373 0.649736911618 0.00504055883908 0.00146805744385 -0.104083389102 0.00843767214859 0.0162513802161 0.395163815702 -0.118966685232 0.00109618599572 -0.0707159814679 -0.169803716214 -0.471260250904 -0.0627149386315 -0.253604543536 -0.130279012976 0.00325637292837 0.0707211413193 -0.192965417896 -0.0840836420634 -0.0687471042111 -0.0328057164649 -0.0175912337056
|
s locked
RE misfit: 1.918
| Num. cohorts | Trajectories | Estimates |
| 4 | 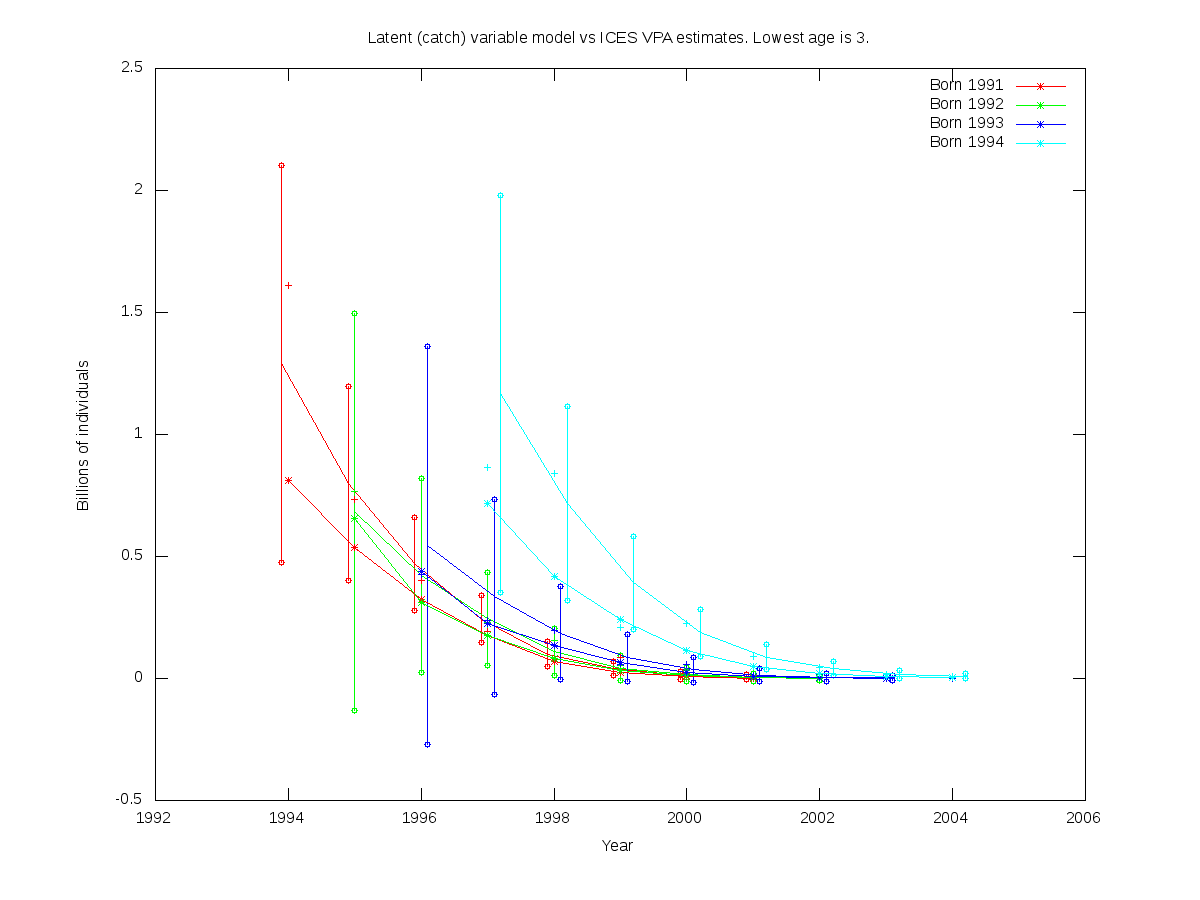 |
- cod.par
# Number of parameters = 6  Objective function value = -40.3946  Maximum gradient component = 7.63789e-05
# N0:
 1.28940 0.682574 0.544627 1.16589
# q:
 0.217345
# logs:
-1.08690000000
# M:
0.474537820067
# logscc:
-1.89710000000
# ce:
 0.00376060837157 0.0338452448155 0.0677024994336 0.0116566858199 0.218301073186 0.601963775088 0.534616170150 0.00357402179224 0.0105343110368 0.0159056937205 0.190850092828 0.218673531975 0.541626850032 0.0361861701610 0.00134314057910 -0.0378912474038 -0.0643734714001 -0.256591516038 0.0792746720682 -0.0576891351257 -0.0193714996913 -0.000139803334695 0.0240184707131 -0.150608147962 -0.0633842800983 -0.0379815450067 -0.00609188927700 -0.0121093479664
|
M locked
RE misfit: 1.66680
| Num. cohorts | Trajectories | Estimates |
| 4 | 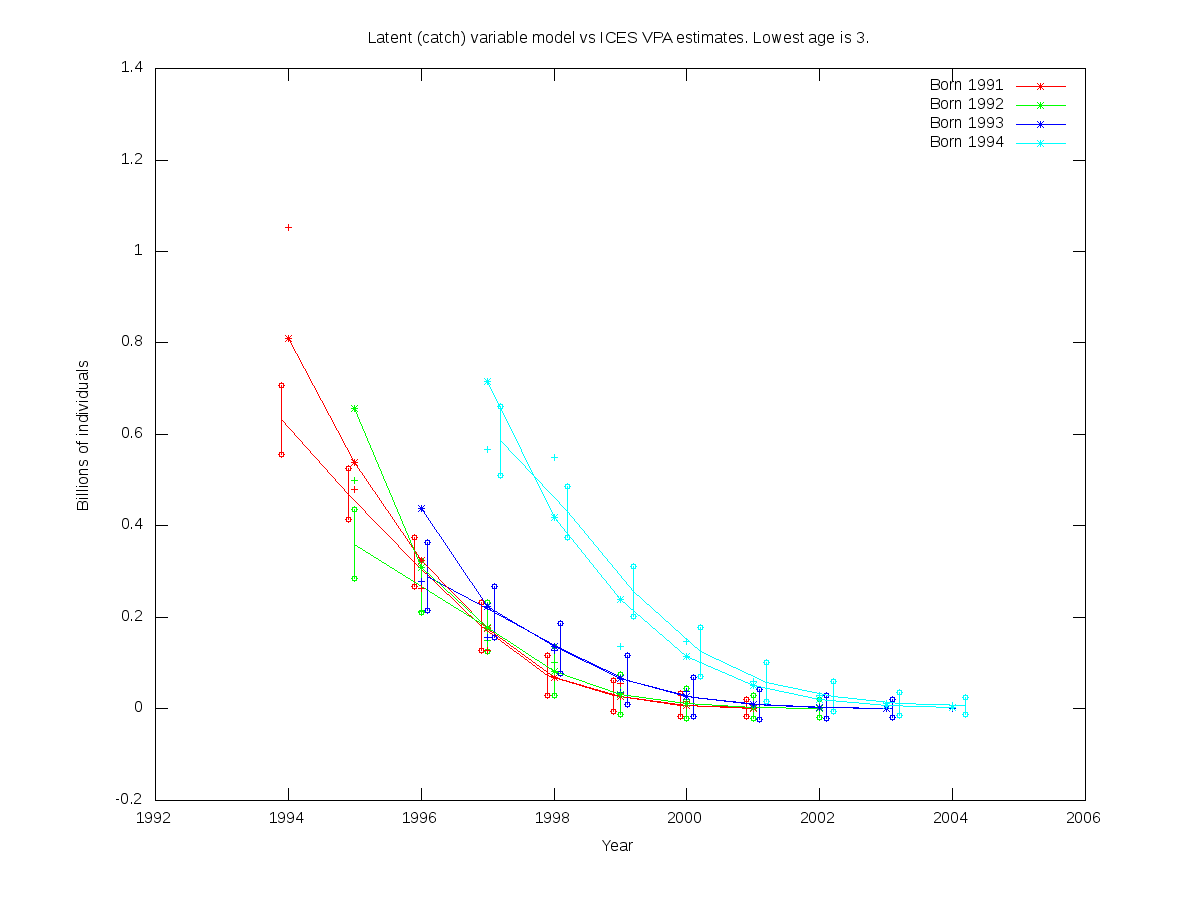 |
- cod.par
# Number of parameters = 6  Objective function value = -37.9372  Maximum gradient component = 5.63388e-06
# N0:
 0.632014 0.360434 0.289677 0.586131
# q:
 0.332385
# logs:
-1.05502714623
# M:
0.286210000000
# logscc:
-1.89710000000
# ce:
 0.00883332156280 0.0800887565390 0.140610949576 -0.00803081126131 0.191165343920 0.619230744576 0.687140301685 0.00705618423549 0.0250604943234 -0.00555943993487 0.119962219580 0.100999884439 0.473208291187 -0.0848302527429 0.00429093175073 -0.0377088532652 -0.0829089375229 -0.377416330435 0.0308416143847 -0.182641212365 -0.0858354795096 0.00603831038060 0.119191773955 -0.114104044339 0.00152396267541 0.00854617949343 0.0338782274762 0.00324578020728
|
Two variables locked
q and s locked
RE misfit: 1.65990
| Num. cohorts | Trajectories | Estimates |
| 4 | 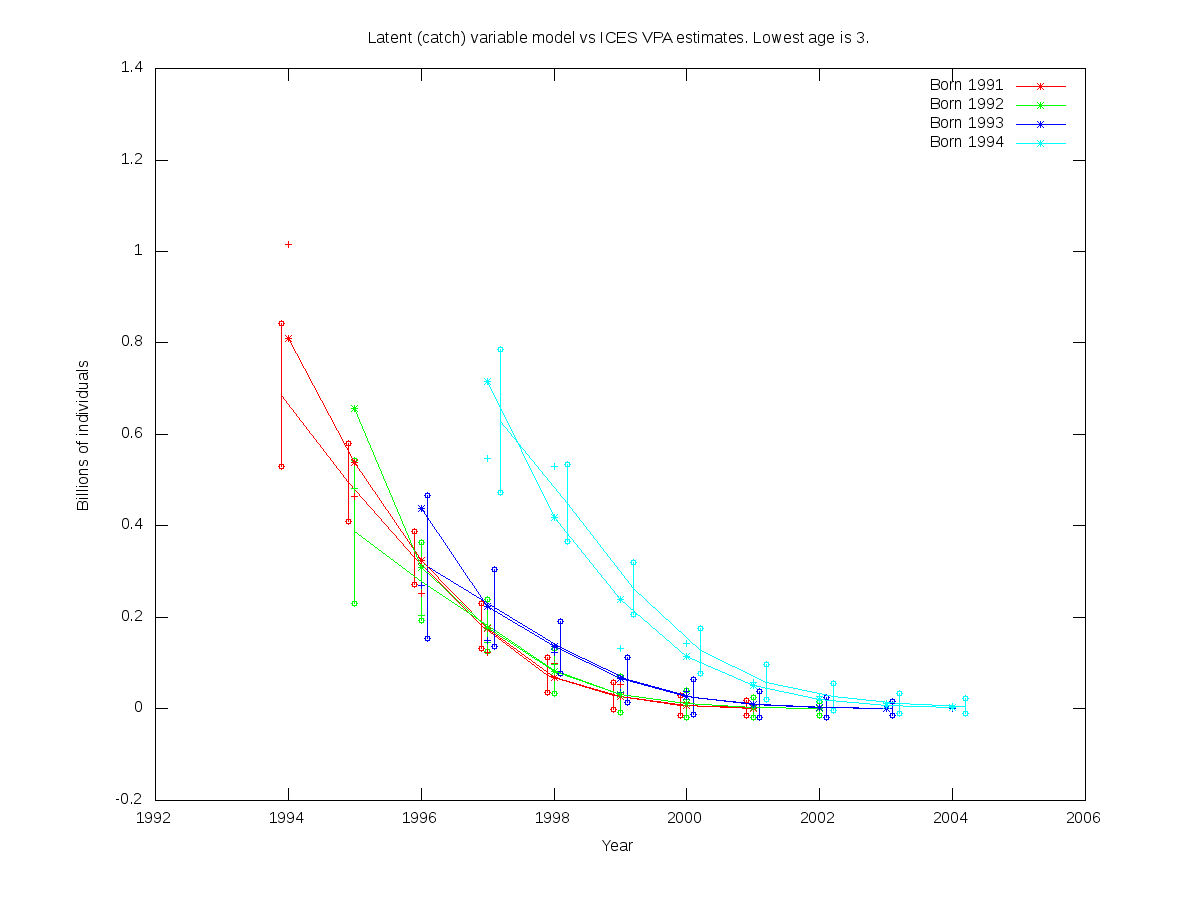 |
- cod.par
# Number of parameters = 5  Objective function value = -38.0972  Maximum gradient component = 0.000437135
# N0:
 0.685628 0.387489 0.310483 0.629294
# q:
 0.344330
# logs:
-1.08690000000
# M:
0.315883583204
# logscc:
-1.89710000000
# ce:
 0.00711604688970 0.0567743212844 0.0623867753076 -0.144763293148 0.0911926293738 0.556072477209 0.690860471698 0.00523360358328 0.000676644507664 -0.112939019091 0.00767476919377 0.0165496980658 0.420252950074 -0.126839594052 0.000755450835444 -0.0773107058577 -0.182514326545 -0.500193964413 -0.0652794968529 -0.267693149543 -0.137209156543 0.00290049090311 0.0708591405019 -0.210617073697 -0.0921076377495 -0.0740264011621 -0.0348492862092 -0.0185144709359
|
q and M locked
RE misfit: 1.65050
| Num. cohorts | Trajectories | Estimates |
| 4 |  |
- cod.par
# Number of parameters = 5  Objective function value = -37.8584  Maximum gradient component = 1.17824e-06
# N0:
 0.627580 0.358021 0.287727 0.581390
# q:
 0.344330
# logs:
-1.05993318505
# M:
0.286210000000
# logscc:
-1.89710000000
# ce:
 0.00849700953009 0.0738983964389 0.114635665033 -0.0605767869284 0.148636644783 0.584028736070 0.681562830388 0.00661485560524 0.0172221483601 -0.0453038342732 0.0735172459448 0.0615758216069 0.441474025058 -0.108013316904 0.00321514715180 -0.0515222900324 -0.119711037824 -0.425713248881 -0.00846577452669 -0.220263078379 -0.108665216714 0.00514010978600 0.104616576886 -0.149316920623 -0.0321513349962 -0.0219414263846 0.00838292664128 -0.00406827482527
|
s and M locked
RE misfit: 1.65410
| Num. cohorts | Trajectories | Estimates |
| 4 |  |
- cod.par
# Number of parameters = 5  Objective function value = -37.9113  Maximum gradient component = 0.000214372
# N0:
 0.632019 0.360314 0.289054 0.585269
# q:
 0.333281
# logs:
-1.08690000000
# M:
0.286210000000
# logscc:
-1.89710000000
# ce:
 0.00910447022477 0.0823389959548 0.141219488406 -0.0217068043024 0.193250920941 0.650384821126 0.729816157969 0.00727802214495 0.0244519118862 -0.0143512513900 0.119261911151 0.101051128265 0.498905665077 -0.0932392819895 0.00397354007808 -0.0441907320120 -0.0955127446577 -0.407234322385 0.0284415051626 -0.197344592129 -0.0929989116772 0.00567971579127 0.119729534207 -0.132005612732 -0.00623349994507 0.00355593865988 0.0322004155567 0.00249223761403
|
Data set used
The following data set was used for all the experiments. It has four cohorts, starts in 1994 and has a maximum age of 7.
Note that since we estimate the stock size starting at age three, the oldest cohort is born in 1991 and consequently is 10 years old in 2001.
- cod.dat
#Generated .dat-file with catch and acoustic/trawl data from ICES report.
#
#Number of cohorts
4

# Cohort birth years (Startaar)
1994 1995 1996 1997

# Last year of observation (Sluttaar)
2001 2002 2003 2004

# Catch data IN MILLIONS. One cohort per row, one year per column.
# First column is the birth year. Last column is not used by .tpl file
# but must be present.
6.531000 42.587000 80.711000 83.017000 34.513000 15.851000 4.787000 1.163000
4.879000 28.782000 69.633000 40.493000 15.778000 6.677000 1.773000 0.529000
7.655000 36.491000 48.972000 31.139000 12.671000 5.266000 1.801000 0.492000
12.827000 88.874000 92.816000 47.210000 22.794000 11.527000 2.887000 1.746000

# Survey section. Surveys included:
#
# ../../ICES_AFWG_2009/no02_ices_afwg_2009_tableA13.txt
#

# Number of surveys per year
1

# Number of survey indices
37

# Survey table: (Cohort, age, survey_number, observed_volume)
  1   0   1 349.800000
  1   1   1 159.800000
  1   2   1 87.200000
  1   3   1 42.200000
  1   4   1 34.000000
  1   5   1 18.700000
  1   6   1 5.200000
  1   7   1 0.600000
  1   8   1 0.600000
  1   9   1 0.100000
  2   0   1 166.200000
  2   1   1 70.500000
  2   2   1 49.700000
  2   3   1 33.800000
  2   4   1 11.200000
  2   5   1 6.900000
  2   6   1 0.800000
  2   7   1 0.500000
  2   8   1 0.100000
  2   9   1 0.700000
  3   0   1 92.900000
  3   1   1 51.700000
  3   2   1 42.400000
  3   3   1 12.200000
  3   4   1 12.900000
  3   5   1 2.400000
  3   6   1 1.200000
  3   7   1 0.500000
  3   8   1 0.200000
  4   0   1 188.300000
  4   1   1 182.600000
  4   2   1 45.400000
  4   3   1 49.300000
  4   4   1 19.800000
  4   5   1 9.500000
  4   6   1 3.800000
  4   7   1 2.200000
# End of file


