admb_real:all_cohorts:preliminary_experiments
This is an old revision of the document!
Preliminary experiments
We test the model following all cohorts on a simple data set, and compare with the ICES VPA estimates.
We follow all cohorts aged 3 to 12 in the period 1994 to 2001. This gives the following .dat file:
- cod.dat
# Auto-generated datfile

# Startyear
1994

# Endyear
2001

# Min age
3

# Max age
12

# Catch
6531.000000 59444.000000 102548.000000 59766.000000 32504.000000 10019.000000 6163.000000 3671.000000 7528.000000 995.000000
4879.000000 42587.000000 115329.000000 98485.000000 32036.000000 7334.000000 3014.000000 1725.000000 1174.000000 1920.000000
7655.000000 28782.000000 80711.000000 100509.000000 54590.000000 10545.000000 2023.000000 930.000000 462.000000 230.000000
12827.000000 36491.000000 69633.000000 83017.000000 65768.000000 28392.000000 4651.000000 1151.000000 373.000000 213.000000
31887.000000 88874.000000 48972.000000 40493.000000 34513.000000 26354.000000 6583.000000 965.000000 197.000000  69.000000
7501.000000 77714.000000 92816.000000 31139.000000 15778.000000 15851.000000 8828.000000 1837.000000 195.000000  40.000000
4701.000000 33094.000000 93044.000000 47210.000000 12671.000000 6677.000000 4787.000000 1647.000000 321.000000  71.000000
5044.000000 35019.000000 62139.000000 62456.000000 22794.000000 5266.000000 1773.000000 1163.000000 343.000000  84.000000
# Survey data
349.800000 404.500000 217.500000  89.500000  22.500000  11.900000   9.400000   3.900000  18.000000   2.700000
166.200000 159.800000 216.600000 104.000000  29.000000   4.400000   4.300000   3.000000   2.600000   8.100000
 92.900000  70.500000  87.200000  89.100000  44.600000   6.500000   1.100000   0.400000   0.900000   1.400000
188.300000  51.700000  49.700000  42.200000  49.900000  20.500000   2.200000   0.500000   0.000000   0.800000
427.700000 182.600000  42.400000  33.800000  34.000000  24.700000   4.900000   0.700000   0.200000   0.100000
150.000000  96.400000  45.400000  12.200000  11.200000  18.700000   9.200000   1.000000   0.200000   0.200000
245.200000 158.900000 145.700000  49.300000  12.900000   6.900000   5.200000   1.200000   0.600000   0.200000
138.200000 171.600000  81.600000  57.300000  19.800000   2.400000   0.800000   0.600000   0.300000   0.100000
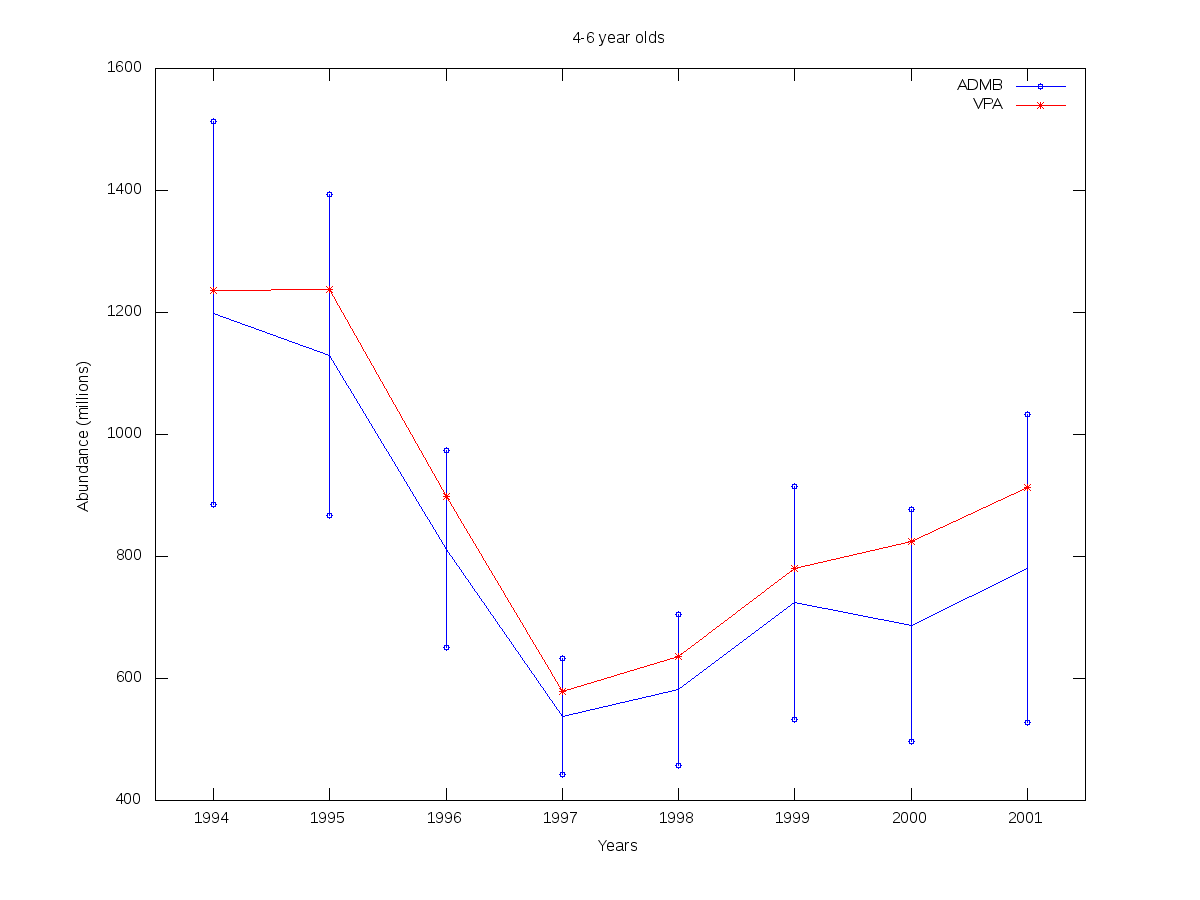
We then run the model and plot the results for two classes, namely 4-6 year olds:
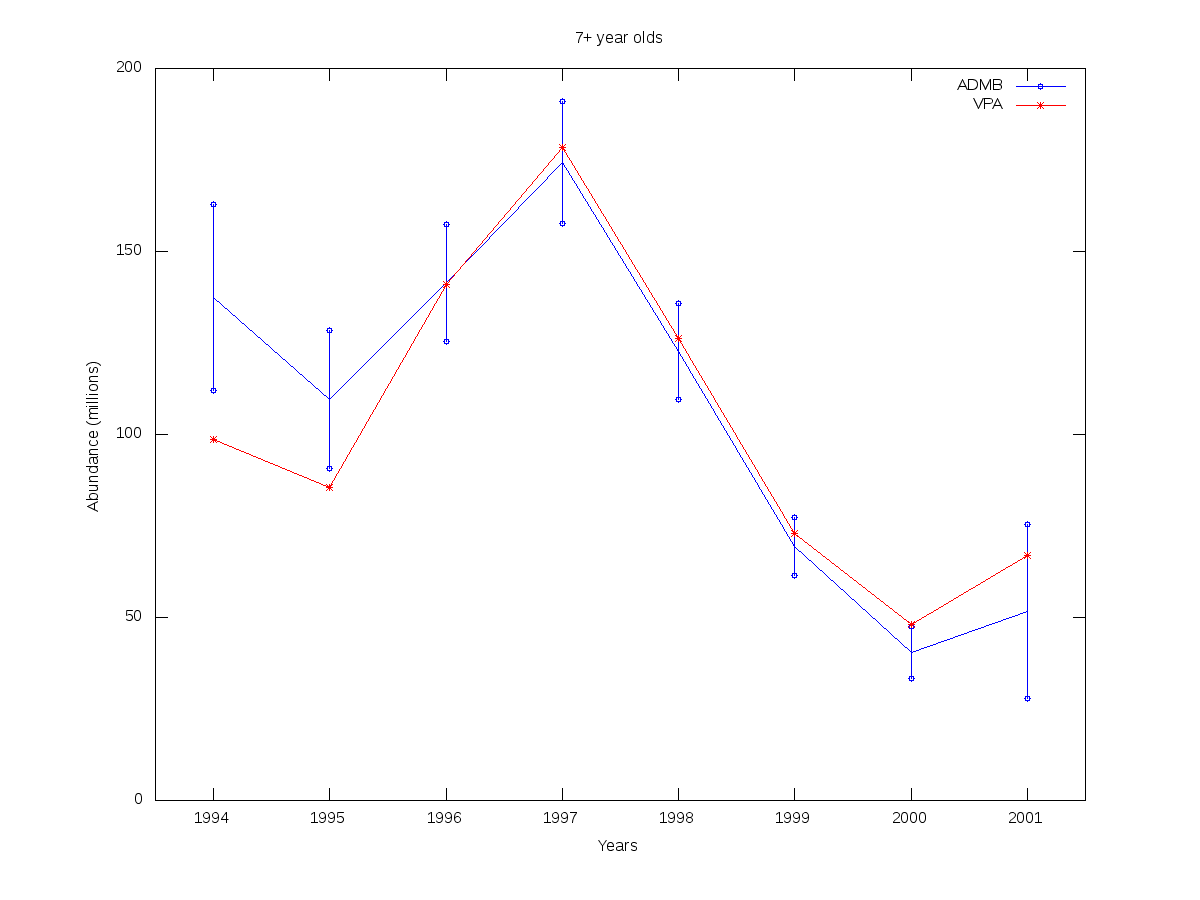
…and 7+ year olds:
As one can see, the curves follow the VPA estimates relatively closely, with the added bonus of 95% confidence intervals.
TBD: Spawning stock biomass
Using these estimates, along with weight and maturity proportion data from ICES reports, we can make similar curves for the spawning stock biomass.
admb_real/all_cohorts/preliminary_experiments.1289915554.txt.gz · Last modified: 2010/11/16 13:52 by lennartfr


